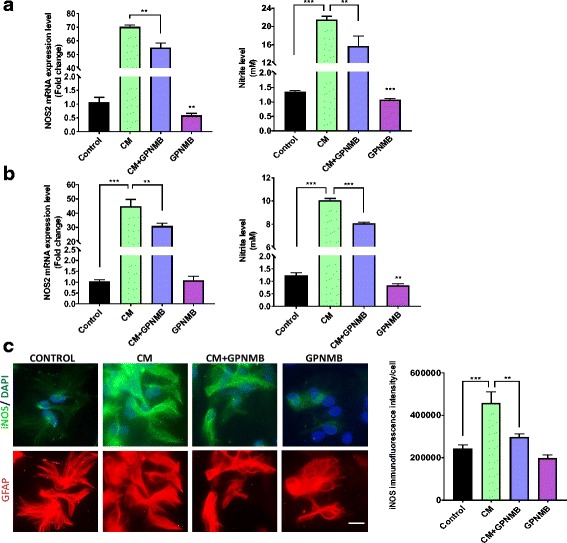
Fig. 5.

GPNMB attenuated cytokine-induced reactive nitrogen species production. a–b Gene expression of NOS2 (left panel) and cell culture supernatant nitrite levels (right panel) from IMA cells (a) and PMAs (b) treated with either CM, GPNMB, or co-treated with both. c Representative immunofluorescent images and quantification for iNOS protein levels in PMAs treated with CM, GPNMB, or co-treated with both (scale bar 20 μm). Asterisks denote statistically significant differences between the different treatment groups or compared to the control (*p < 0.05, **p < 0.01, and ***p < 0.001)
