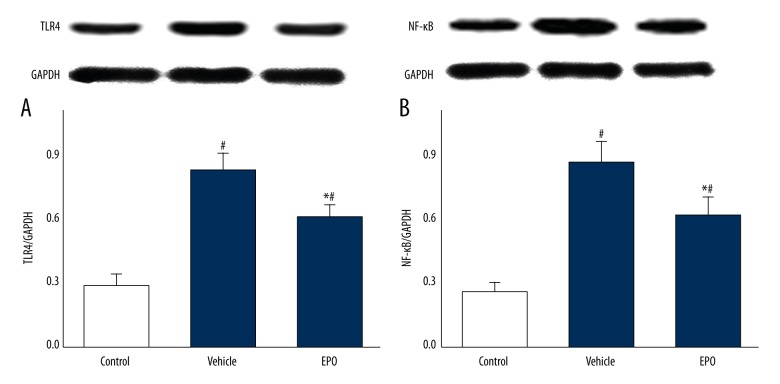
Figure 5.
(A, B) The effects of EPO on protein expression of TLR4 and NF-κB. Comparison of protein levels of TLR4 and NF-κB in lung tissue by Western blotting among all groups. Data are expressed as means ±SD and were analyzed by ANOVA followed by Bonferroni correction for multiplicity where appropriate. n=8 for each group. # P<0.05 compared with control group; * P<0.05 compared with vehicle group.

