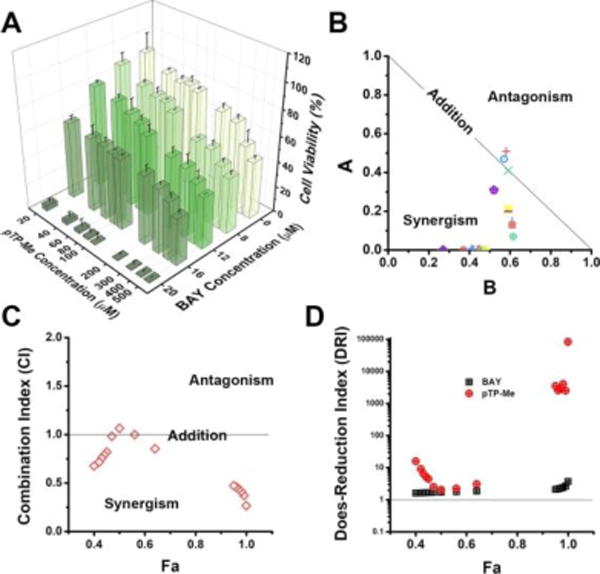
Figure 4.

(A) 48-hour cell viability of HeLa cells incubated with pTP-Me (20, 40, 60, 80, 100, 200, 300, 400, and 500 μM) in combination with BAY (0, 8, 12, 16, and 20 μM). (B) Normalized Isobologram,34 (D) Combination Index (CI)34 plot and (D) Dose-Reduction Index (DRI)34 plots for the combination of pTP-Me and BAY. All the analysis shown in (C-D) was based on the combination: pTP-Me 20-500 μM and BAY 16, 20 μM, 18 data points in total.
