
FIGURE 2.
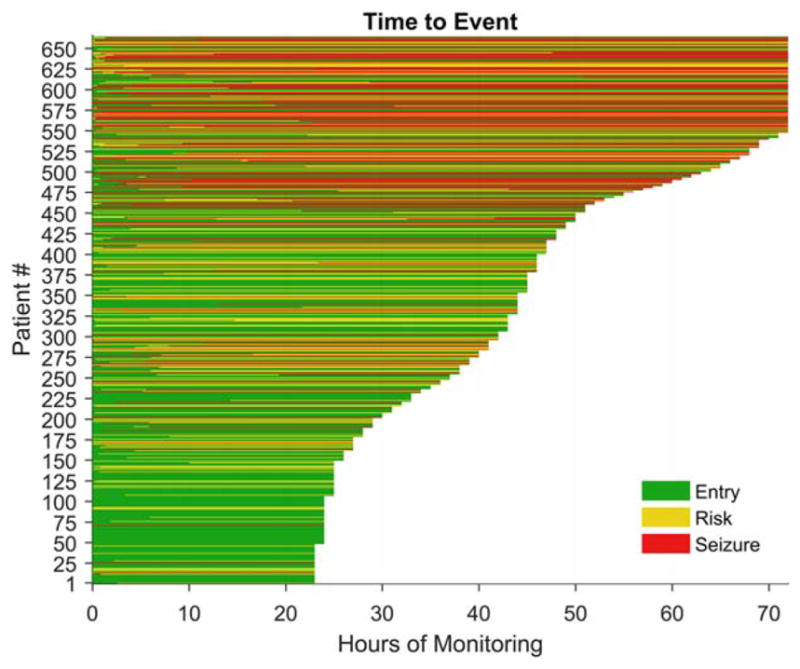
Swimmer plot showing the raw data with a line for each subject. The length of the line is the duration of monitoring, and the color reflects the state (entry, risk, or seizure). The choice of a 72-hour time window was chosen to minimize the number of censored subjects balanced against the clinical utility of the model. [Color figure can be viewed atwileyonlinelibrary.com]