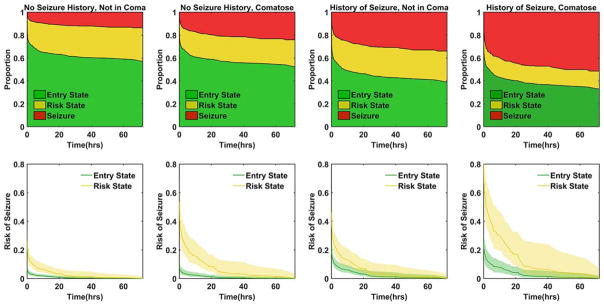
FIGURE 3.
Results of the multistate survival analysis. The upper panels show the estimated proportion of subjects in each state (entry, risk, and seizure) based on the respective clinical risk factors of coma and history of seizures. The lower panels show the remaining risk of developing seizures in the 72-hour period for the entry and risk states respective to their clinical risk factors. The shaded area represents the bootstrapped 95% confidence interval. [Color figure can be viewed at wileyonlinelibrary.com]

