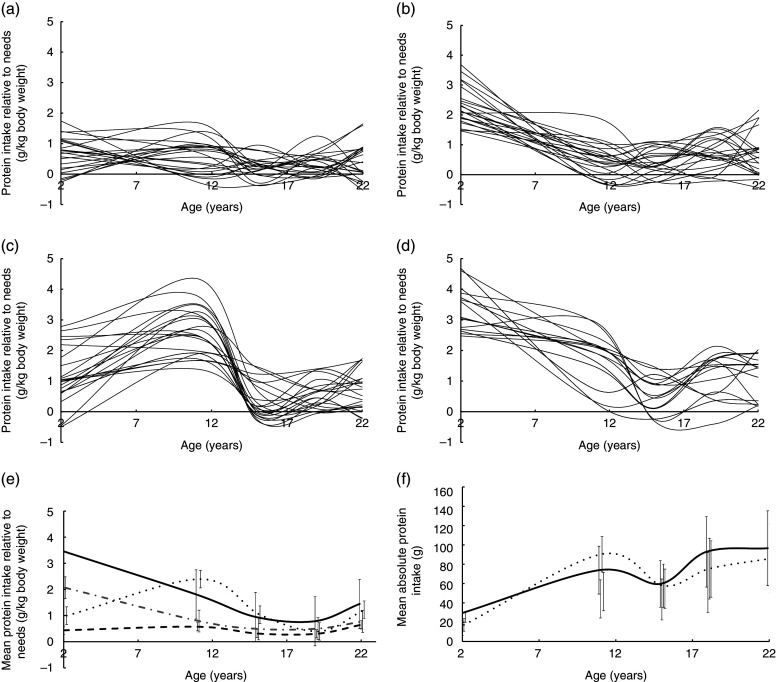
Fig. 2.
Trajectories of protein intakes relative to needs from 2 to 22 years in the Cebu Longitudinal Health and Nutrition Survey (n 2586). Fig. 1(a)–(d) each show randomly selected spaghetti plots or trajectories of protein intake relative to needs from actual individuals in the Cebu Longitudinal Health and Nutrition Survey. Four trajectories were derived using latent class growth curve analyses. (a) Subset of the ‘normal consumers’ who constituted 58 % of the sample; (b) ‘high consumers during infancy’ (20 %); (c) ‘usually high consumers’ (18 %); (d) ‘always high consumers’ (5 %); (e) mean protein intake relative to needs (g/kg body weight) by trajectory with 95 % CI; (f) mean absolute protein intakes (g) and standard deviations for those trajectories.  , Usually high consumers;
  , always high consumers;
  , high consumers during infancy;
  , normal consumers.

