
Figure 2.
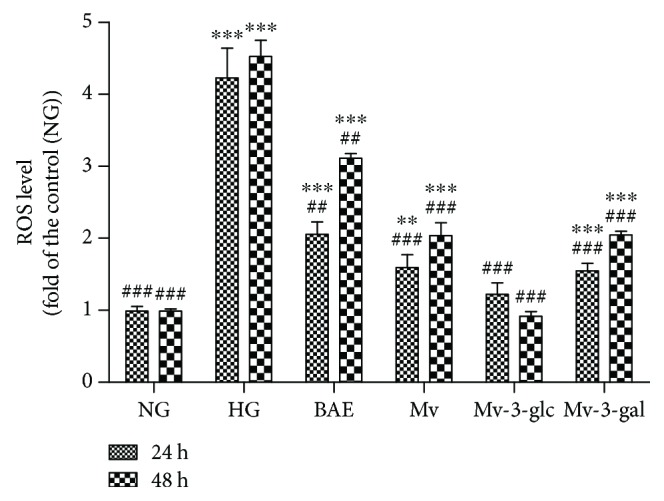
Effects of different treatment on ROS levels in HRCECs exposed to high glucose for 24 and 48 h. ∗∗ and ∗∗∗ indicate P < 0.01 and P < 0.001, respectively, compared to each NG group; ## and ### indicate P < 0.01 and P < 0.001, respectively, compared to each HG group.