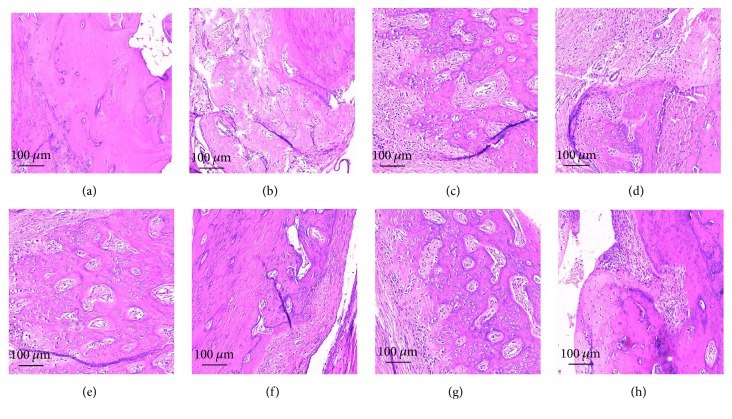
Figure 5.
Synovium pathomorphology as seen by hematoxylin-eosin-staining in each group, from the 1st day to the 42nd day. (a) Normal group. (b) Model group, 14th day. (c) Model group, 28th day. (d) Model group, 42nd day. (e) p-CA group, 28th day. (f) p-CA, 42nd day. (g) OD group, 28th day. (h) OD group, 42nd day.

