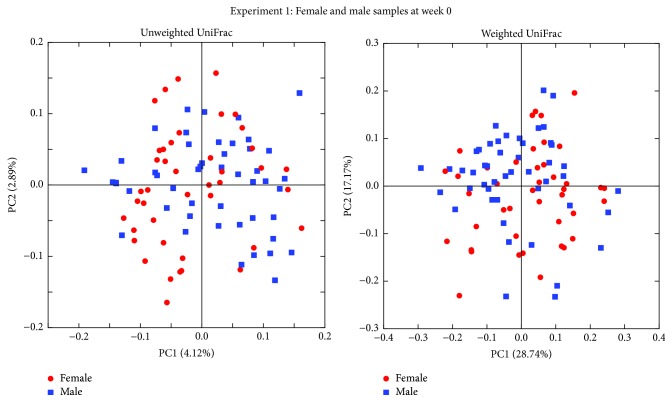
Figure 2.
Sex dependence of the fecal microbiota. PCoA plots of fecal microbiotas of female (red circle) and male (blue square) mice at week 0 in experiment 1. PCoA plots of both unweighted and weighted UniFrac distances demonstrate no difference between sexes. Forty-eight female and 48 male mice were used for the experiment; however, 6 female mice samples were excluded as less than 5000 sequences were obtained.

