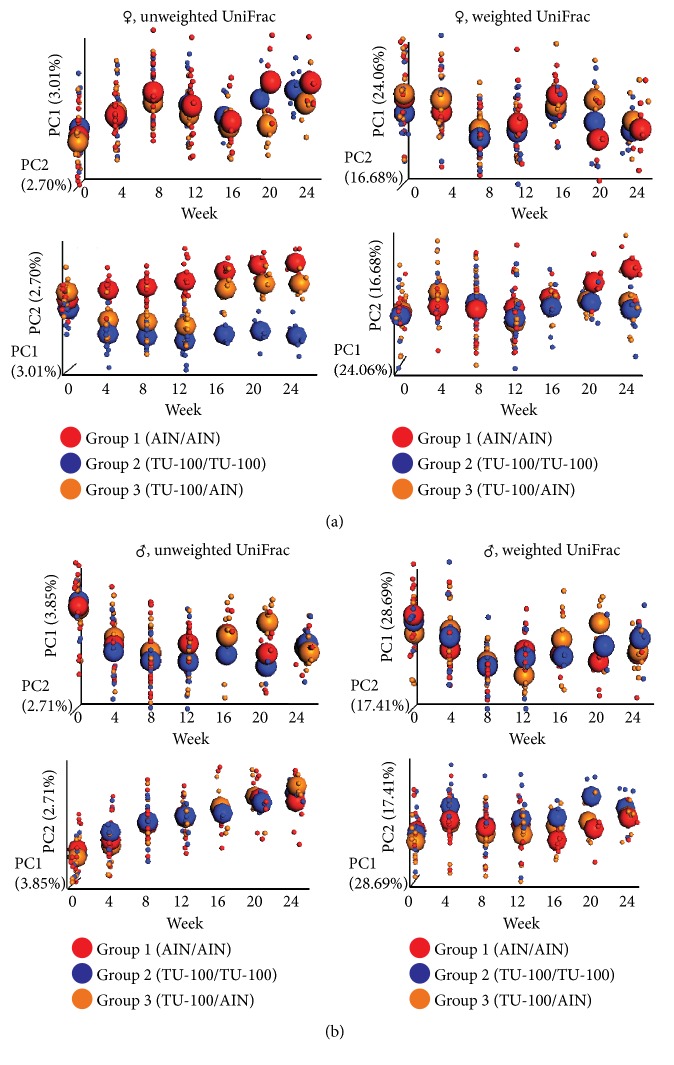
Figure 4.
Chronological Changes of Fecal Microbiotas by 1.5% TU-100. Female and male fecal microbiotas were analyzed every 4 weeks from weeks 0 to 24. PCoA plots of unweighted UniFrac distances and weighted UniFrac distances over time are shown for female (a) and male (b) samples. Small dots represent individual samples and large spheroids represent means of each group. Red, blue, and orange dots/spheroids are for group 1 (fed AIN-76A for 24 weeks), group 2 (fed 1.5% TU-100 for 24 weeks), and group 3 (fed 1.5% TU-100 for 12 weeks and then AIN-76A for 12 weeks), respectively.

