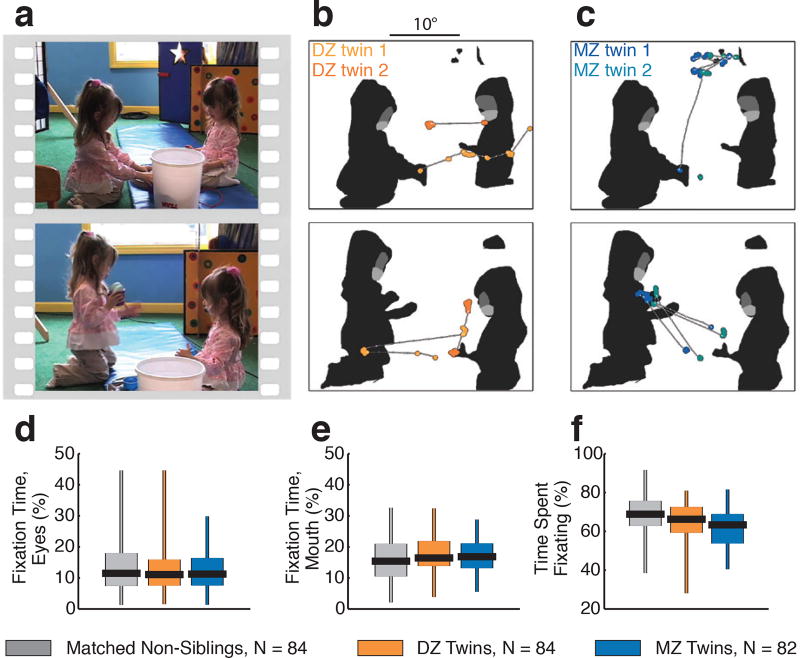
Extended Data Figure 6. Social visual engagement when watching Triadic Peer Interaction stimuli in 250 paired toddlers: dizygotic twins (N=84, 42 pairs), monozygotic twins (N=82, 41 pairs), and non-sibling comparison children (N=84, randomized to 42 pairs).
a, Example still images from triadic peer interaction stimuli. b, Data from two typically-developing 18-month-old dizygotic (DZ) twins. c, Data from two typically-developing 18-month-old monozygotic (MZ) twins. In (b) and (c), two seconds of eye-tracking data are plotted, corresponding to each image in (a) (the image onscreen at midpoint of the two-second data sample). Data are overlaid on each image’s corresponding regions of interest, shaded to indicate eyes, mouth, body, and object regions. Saccades are plotted as thin white lines with white dots; fixation data are plotted as larger colored dots. d-f, Fixation time summaries for each comparison group for percentage of total fixation time on eyes region (d), percentage of total fixation time on mouth region (e), and percentage of total time spent fixating (f). Boxplots span full range of data collected, with vertical lines extending from minimum to maximum values, boxes spanning the 25th to 75th percentiles, and horizontal black lines marking medians.

