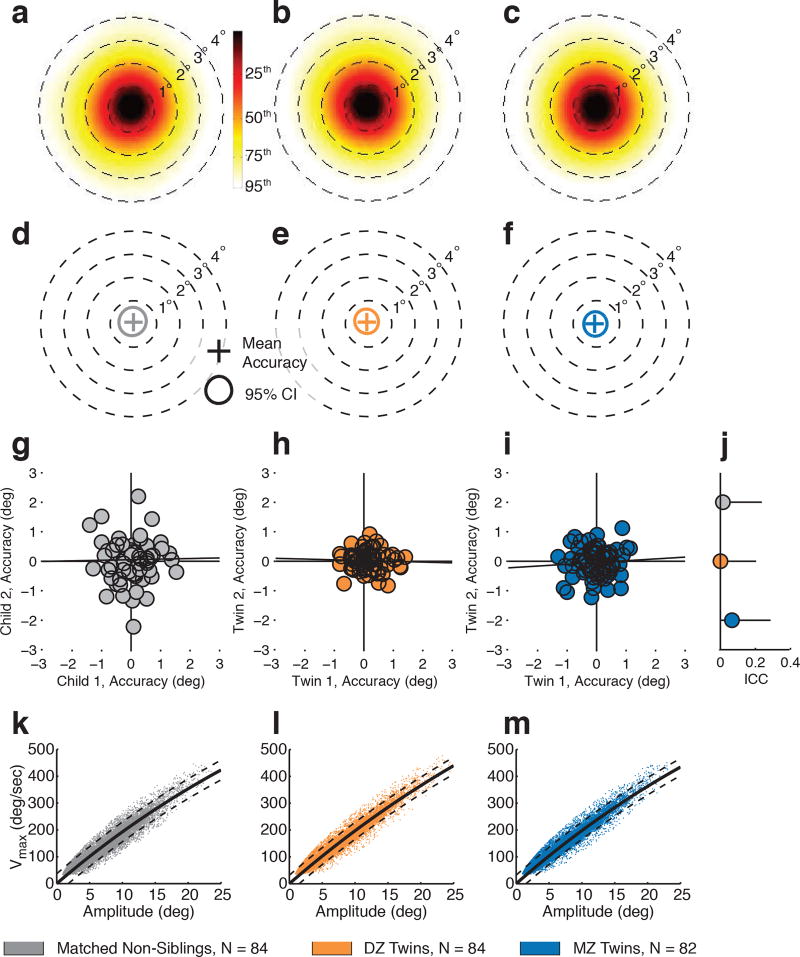
Extended Data Figure 2. Between-group controls for calibration accuracy and oculomotor function.
To test for group-wise differences unrelated to subsequent paired comparisons in the main study experiments we measured calibration accuracy and oculomotor function. a-c, Total variance in calibration accuracy for age- and sex-matched non-sibling controls (a), DZ twins (b), and MZ twins (c). Plots show kernel density estimates of the distribution of measured fixation locations relative to calibration accuracy verification targets. d-f, Average calibration accuracy for non-sibling controls (d), DZ twins (e), and MZ twins (f). Crosses mark the location of mean calibration accuracy, while annuli mark 95% confidence intervals (CI). g-i, Concordance in calibration accuracy measures for non-sibling controls (g), DZ twins (h), and MZ twins (i). Measures in (g-i) are average accuracy per child across all accuracy verification trials. j, Intraclass correlation coefficients (ICC, plotted with 95% confidence intervals). k-m, Oculomotor relationship between maximum saccade velocity (Vmax) and amplitude for non-sibling controls (k), DZ twins (l), and MZ twins (m).

