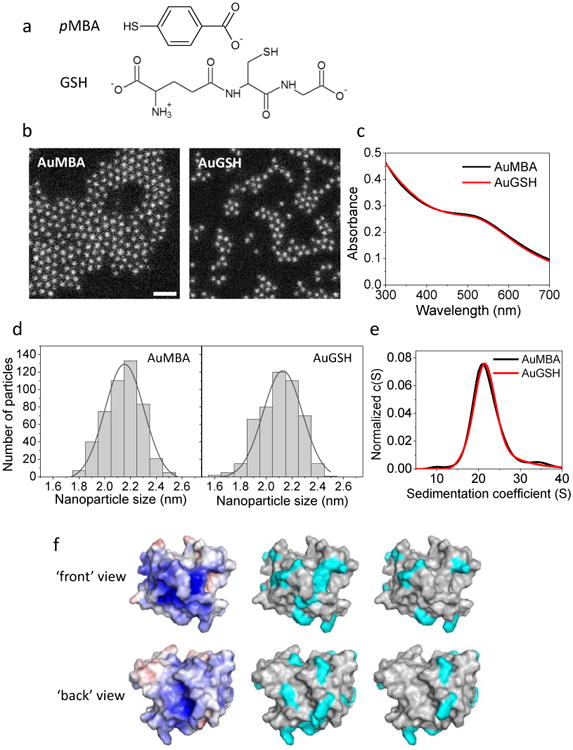
Figure 1. Nanoparticles and CrataBL.

a, Structure of p-mercaptobenzoic acid (pMBA) and glutathione (GSH) passivating ligands. b, Characterization of NP size and uniformity by dark-field scanning transmission electron microscopy. NPs are approximately 2 nm in core diameter and highly uniform (2.1 ± 0.2 nm). Scale bar, 10 nm. c, UV-visible spectra of NPs. d, Histograms of STEM measurements of nanoparticle diameter. e, Characterization of NP size and uniformity by analytical ultracentrifugation. NPs are ∼ 2 nm in core diameter based on a sedimentation coefficient of ∼ 21 S (cf. ref. [25]). NPs appear reasonably uniform as judged from the widths of their sedimentation coefficient distributions (note these widths are also affected by NP diffusion). f, Left: Surface electrostatic potential of CrataBL scaled from -5 to +5 kT/e (red to blue; calculated with APBS). Middle: surface areas (cyan) corresponding to the 16 Arg+ and 5 Lys+ residues of the protein. Right: areas corresponding to the 8 Arg+ and 2 Lys+ residues deemed to be accessible to the solvent (calculated with GetArea).
