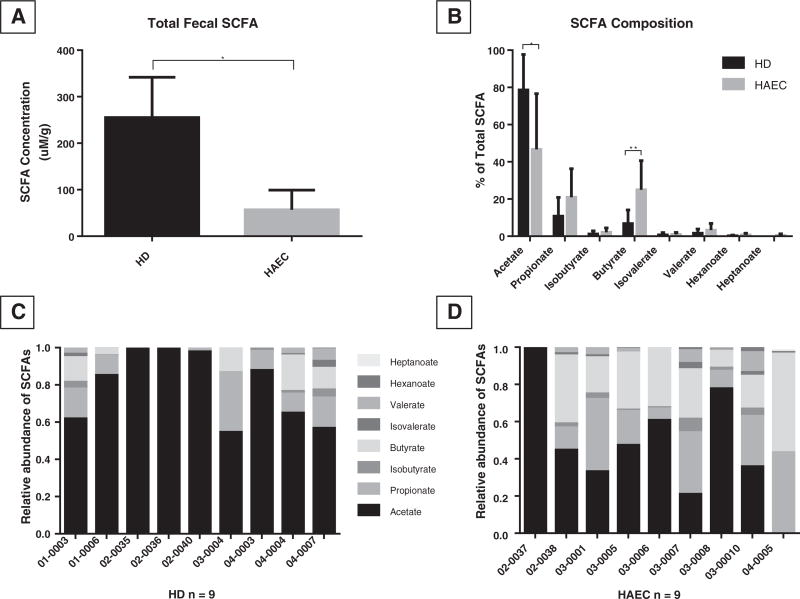
Fig. 1.
(A) Fecal SCFA concentration was significantly reduced in HAEC children versus those with HD without HAEC. (B) Individual SCFAs expressed as % of total SCFAs from HD children with a history of HAEC and those with no history of HAEC. (C) Histograms demonstrating the fecal SCFA composition of individual subjects with HD and HAEC (D). Individual subject numbers are labeled on the X axis and expressed as relative SCFA abundance per each subject. *p < 0.05, *p < 0.01.

