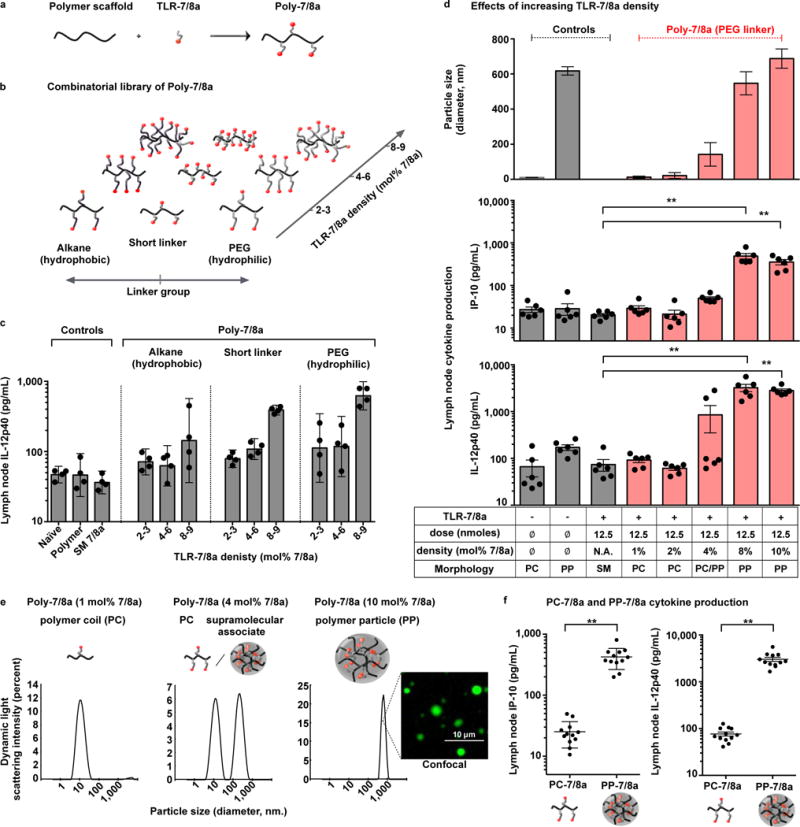
Figure 1. Increasing densities of TLR-7/8a arrayed on polymer carriers is associated with particle formation and enhanced lymph node cytokine production.

(a) Poly-7/8a were generated by reacting linear biocompatible polymers with nucleophilic TLR-7/8a. (b) Combinatorial synthesis was used to generate Poly-7/8a with varying linker group composition and TLR-7/8a density. The density of agonist arrayed on the polymers (mol% 7/8a) is reported as the percentage of monomers that are linked to TLR-7/8a (e.g., 10 mol% 7/8a indicates 10 out of 100 monomers are linked to TLR-7/8a). (c) A combinatorial library of Poly-7/8a (12.5 nmoles) were subcutaneously administered into hind footpads of mice. After 24 h, lymph nodes draining the site of immunization were harvested and processed to generate a cell suspension that was cultured for 8 h and then evaluated for the presence of IL-12p40 (n = 4). (d) Controls or Poly-7/8a with increasing densities of TLR-7/8a (normalized to 12.5 nmoles TLR-7/8A) were evaluated for particle formation by dynamic light scattering (n = 3) and the capacity to induce IP-10 (n = 6) and IL-12p40 (n = 6) cytokine production in draining lymph nodes at 24 h and 96 h, respectively, after administration. (e) Size distribution plots from dynamic light scattering are shown for selected samples; a confocal microscopy image is shown for a Poly-7/8a with 10 mol% 7/8a that forms particles in aqueous conditions. (f) Data from panel (d) for which Poly-7/8a with 1–2 mol% 7/8a that exist as unimolecular polymer coils (PC-7/8a) or Poly-7/8a with 8–10 mol% 7/8a that exist as submicron polymer particles (PP-7/8a) are grouped together to correlate the effect of Poly-7/8a morphology with lymph node IP-10 (n = 12) and IL-12p40 (n = 12). In vivo screens are representative of two independent experiments. Data on linear axes are reported as mean ± SEM. Data on log scale are reported as geometric mean with 95% Confidence Interval (CI). Comparison of multiple groups for statistical significance was determined using Kruskal-Wallis ANOVA with Dunn’s post test; Student’s T test was used for comparison of 2 groups; ns, not significant (P > 0.05); *, P < 0.05; **, P < 0.01. SM = small molecule; PC = polymer coil; PP = polymer particle.
