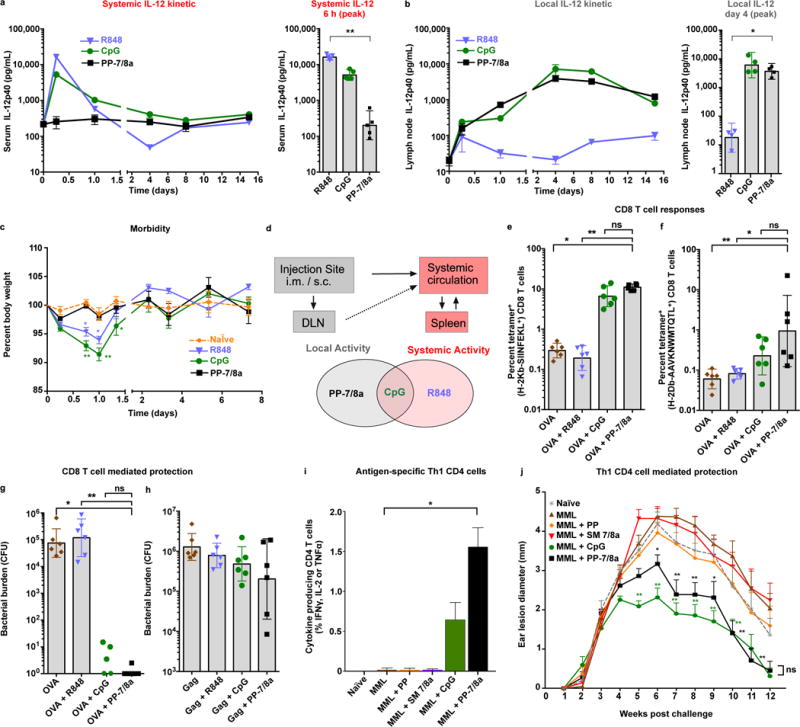
Figure 4. Persistent, locally restricted innate immune activation is necessary and sufficient for eliciting protective CD8 and Th1-type CD4 T cell responses.

(a–c) CpG ODN 1826 (3.1 nmoles, 20 μg), R848 (62.5 nmoles, 20 μg) or PP-7/8a (62.5 nmoles, 120 μg) were delivered subcutaneously into both hind footpads of C57BL/6 mice. (a) Supernatant of ex vivo cultured lymph node cell suspensions (n = 4) and (b) serum (n = 5) were assessed for IL-12p40 by ELISA at serial timepoints. (c) Percent body weight change (n = 3) following subcutaneous administration of different vaccine adjuvants (significance is shown for comparison with naïve; two-way ANOVA with Bonferroni correction). (d) Relationship between biodistribution and local and systemic innate immune activation. (e, f) C57BL/6 mice received subcutaneous administration of protein antigen (either 50 μg of OVA, or 20 μg of SIV Gag p41) formulated with adjuvant at days 0 and 14. At day 24, tetramer+ CD8 T cell responses were assessed from whole blood by flow cytometry (n = 6). (g, h) Mice were challenged intravenously at day 28 with either (g) LM-OVA or (h) LM-Gag, and bacterial burden in spleens (n = 6) was evaluated on day 31 and 30, respectively. (i–l) C57BL/6 mice received subcutaneous immunizations of 20 μg of MML with or without adjuvant on days 0, 21 and 42. (i) Splenocytes were isolated on day 70 and stimulated in vitro with an MML peptide pool. CD4 T cells in the mixed splenocyte cultures were evaluated for Th1 characteristic cytokine (IFNγ, IL-2 and TNFα) production (n = 4). (j) Mice were challenged intradermally in both ears with L. major at day 70. Ear lesion diameters (n = 6) were measured for 12 weeks (significance is shown for comparison with protein alone). All data are representative of two or more independent experiments, except the Leishmania ear lesion kinetic is from a single study. Data on log scale are reported as geometric mean with 95% CI. Unless stated otherwise, comparison of multiple groups for statistical significance was determined using Kruskal-Wallis ANOVA with Dunn’s post test; ns, not significant (P > 0.05); *, P < 0.05; **, P < 0.01.
