
Figure 2.
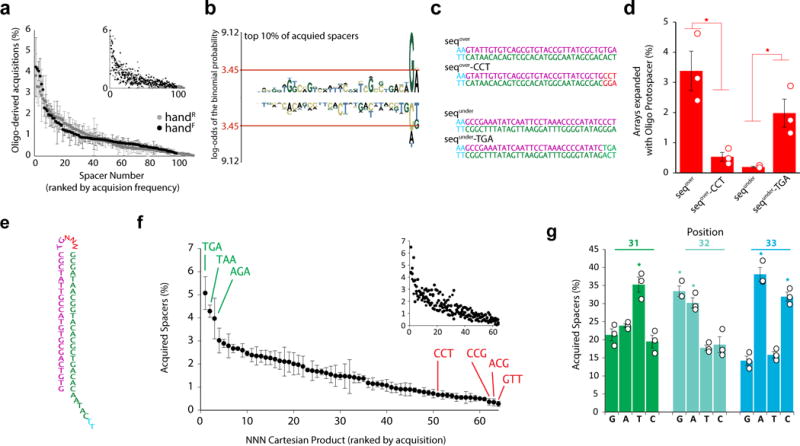
Sequence determinants of acquisition. a. Acquisition frequency for individual protospacers (of oligo-derived acquisitions) for both images, ranked by frequency. Main plot circles represent mean ± SEM. Smaller inset shows each replicate (n=3). b. pLogo30 of the top 10% of protospacers (all protospacers as background). Red line indicates p<0.05. Over-representation is positive, under-representation is negative. c. Sequences designed to test the motif. d. Arrays expanded with the sequences indicated in c. Unfilled circles represent individual replicates. Bars show mean ± SEM. *=p<0.05. e. NNN-containing oligo. f. Acquisition frequency of protospacers containing each NNN Cartesian product (of oligo-derived acquisitions), ranked by frequency. Plots as in a. g. Representation of nucleotides at positions 31-33 in acquired spacers from the NNN-containing oligo. Plot as in d. Statistical details in Supplementary Table 1.