
Extended Data Figure 3.
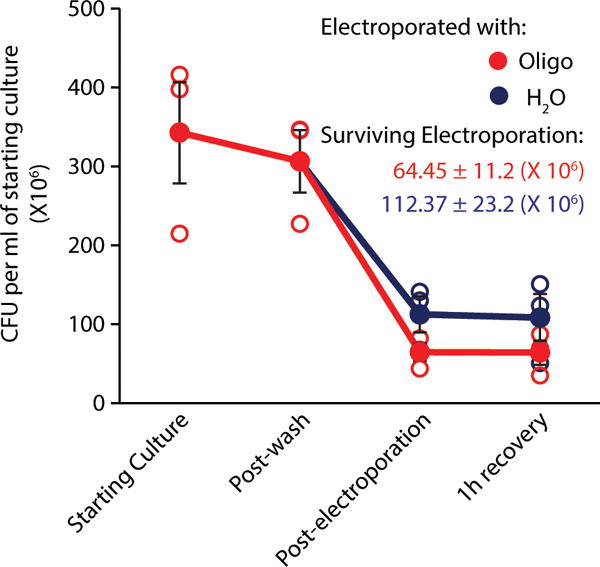
Cell surviving electroporation. Colony forming units per milliliter of starting culture prior to beginning electroporation, after pre-electroporation washes, immediately post-electroporation, and after 1 hour of recovery. Cells in red were electroporated with a minimal hairpin oligo, those in blue were electroporated in water alone. Unfilled circles represent individual biological replicates (n=3), filled circles are mean ± SEM.