
Extended Data Figure 5.
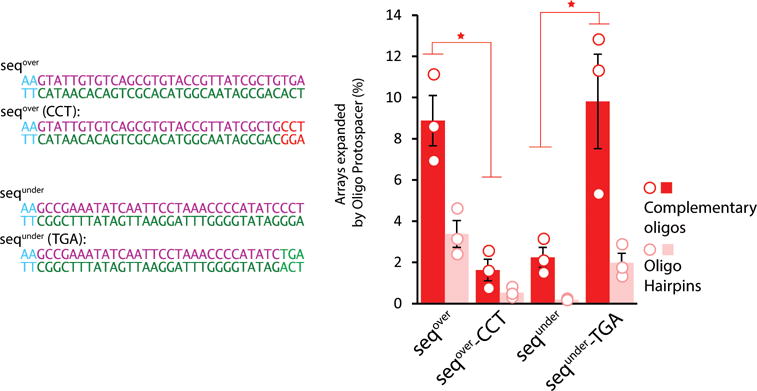
Effect of the 3’ motif on protospacer acquisition when supplied as two complementary oligos. Individual sequences designed to directly test the motif identified in Figure 2b shown to the left. To the right, percent of arrays expanded following electroporation of the sequences indicated as two complementary oligos (in dark red), rather than a minimal oligo hairpin (shown for comparison in pink). Unfilled circles indicate individual biological replicates. Bars show mean ± SEM. * indicates p<0.05. Additional statistical details in Supplementary Table 2.