Figure 1.

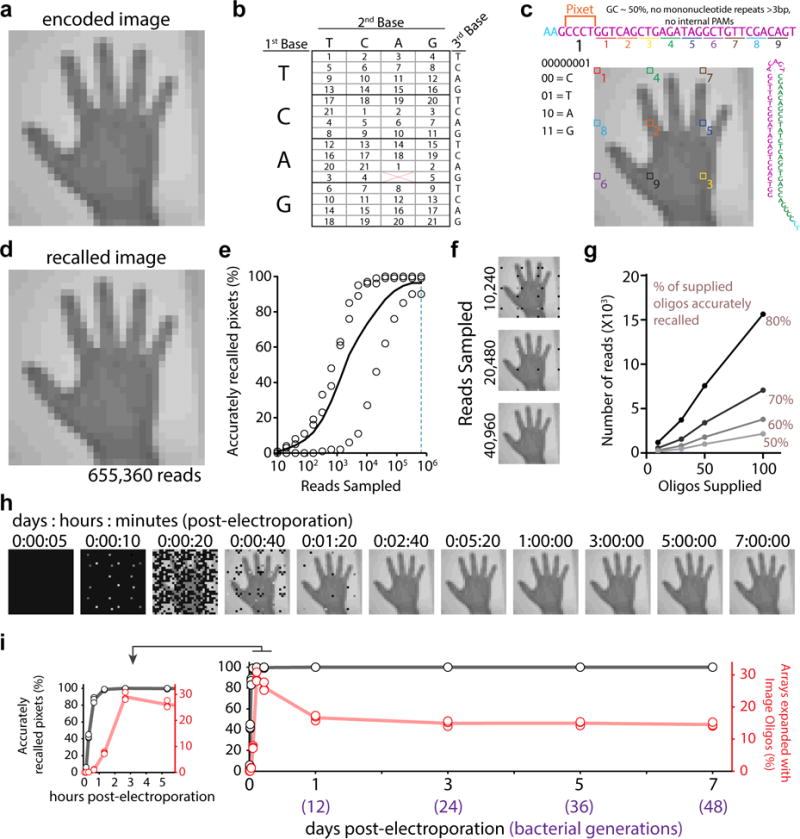
An image into the genome. a. handF image. b. Encoding for 21 colors. c. Sequence at top shows the linear protospacer with pixet code followed by pixel values (distributed across image). Pixet shown under nucleotides, with binary-to-nucleotide conversion. Small colorful numbers below protospacer indicate individual pixels boxed on the image. Minimal hairpin protospacer shown on the right. d. One replicate at 655,360 reads. Black shown if no pixel information recovered. e. Accurately recalled pixets by read depth. Unfilled circles indicate points from individual replicates, black line shows the mean. f. Result of down-sampling the sequencing reads. g. Reads required to reach 50, 60, 70, and 80% accuracy on a given oligo set as a function of number of oligos supplied. h. Image recall at time-points after electroporation. i. Quantification of the percentage of accurately recalled pixets (in black) and percentage of arrays with oligo-derived spacers (in red) by time-point. Unfilled circles represent individual replicates, lines show the mean. Inset graph (left) expands first six hours. Statistical details in Supplementary Table 1.
