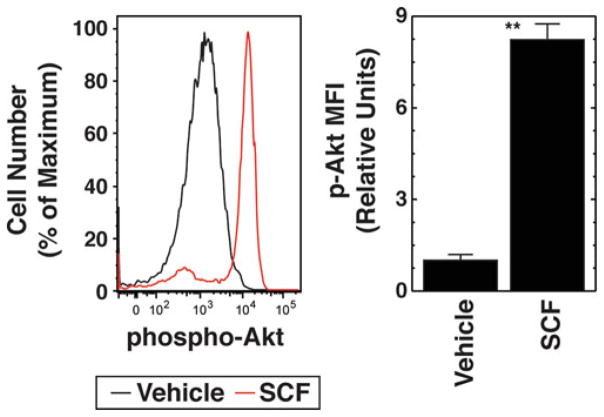
Fig. 3.
Phospho-flow cytometric analysis of cytokine signaling. Left: Flow cytometry plots of phospho-Akt after 10 min treatment with vehicle (black) or 10 ng/ml SCF (red) in control Ter119−/CD71high cells cultured in expansion medium for 24 h. Right: Phospho-Akt quantitation. MFI is expressed relative to unstimulated cells (mean ± SE, three biological replicates)

