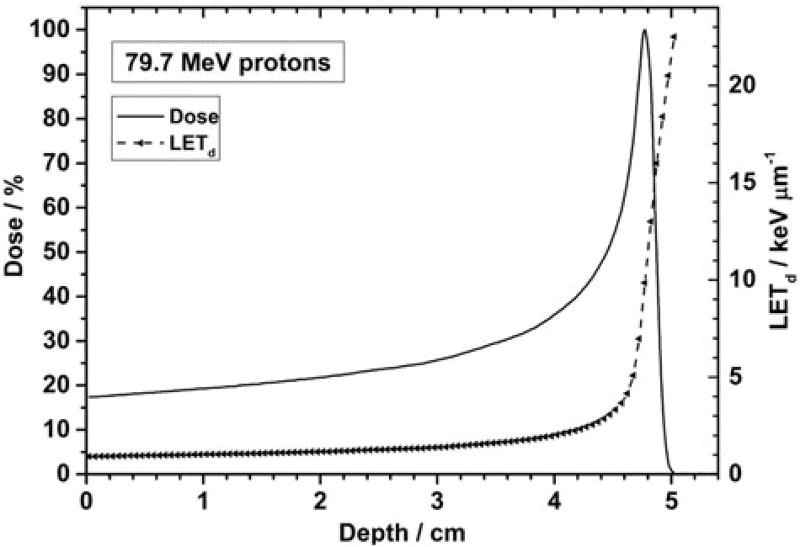
Figure 1.
Depth-LET and depth-dose (Bragg) curves for a 79.7 MeV monoenergetic 20 cm × 20 cm scanned proton beam. The LET increases slowly up to about one cm before the Bragg peak and steeply at points beyond the peak. Reproduced from Guan et al. [1]

