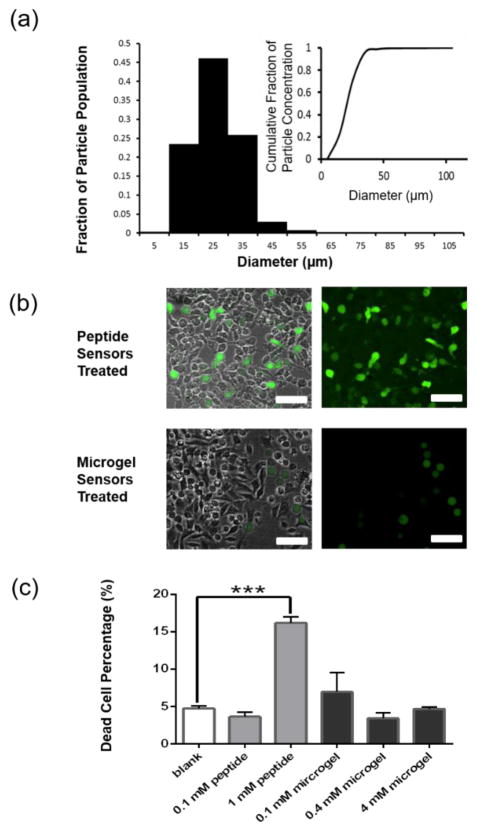
Figure 2.
Size distribution and cellular uptake of the microgel sensors. (a) The size distribution of the microgel sensors was analyzed from fluorescent images (n=990). (b) Fluorescent images of A375 cells which were incubated with 1 mM Peptide sensors or microgel sensors (synthesized with 4 mM sensor peptides). Scale bars, 100 μm. (c) Percentage of dead cells detected by staining with ethidium homodimer.

