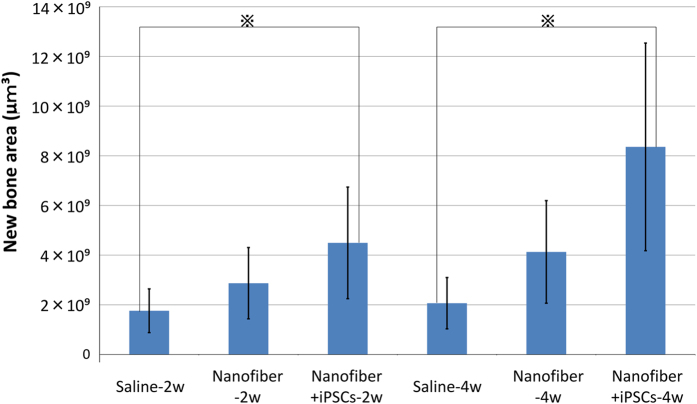
Figure 6.
Micro-CT analysis of bone regeneration. Comparison of new bone volume (μm3) in a region of interest of six groups. The data are expressed as the mean±s.d. and were analysed with analysis of variance and Bonferroni testing. All of the data represent at least three independent experiments. P<0.05 was considered to be statistically significant. ※P<0.05.

