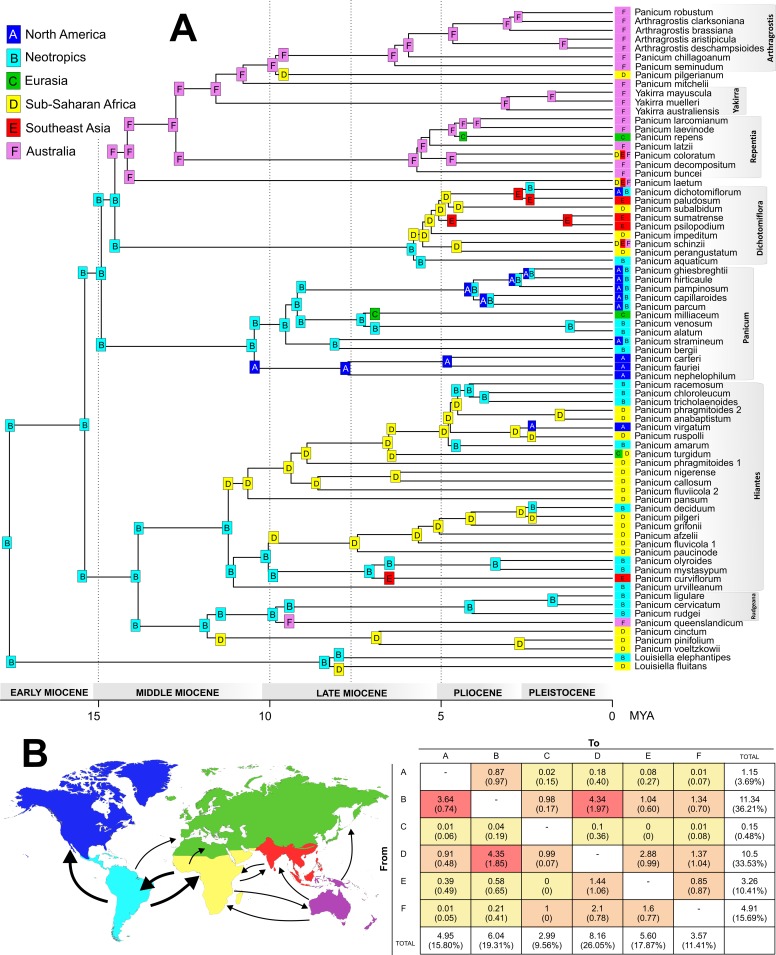
Fig 3. Biogeography of subtribe Panicinae.
A. Ancestral range estimation (ARE) on the Panicinae chronogram using the BayArea+J model in BioGeoBEARS. States at nodes (squares) represent the area with highest ML probability before the instantaneous speciation event, whereas those on branches represent the state of the descendant lineage immediately after speciation. Squares with more than one letter refer to ancestral areas composed of more than one biogeographical area. Branch labels have been removed to reduce overlap in cases where they are identical to the state at both the ancestral and the descendant node. Boxes to the left of taxon names indicate areas of tip species. S2 Fig of supplementary material provides all ARE per node and corner with pie charts representing probability of each ancestral area. B. Results from 1000 biogeographic stochastic mapping (BSM) under the BayArea+J model in BioGeoBEARS. Numbers of dispersal events (range-expansion dispersals plus cladogenetic founder/jump dispersal) among areas for Panicinae. Counts of dispersal events were averaged across the 1000 BMSs and are presented here with standard deviations in parentheses. Colour temperature indicates the frequency of events. The sum and corresponding percentages of events involving each area, either as a source for dispersal (the rows) or as a destination (the columns). Map on the left shows main dispersal routes recovered in the BSM analyses. Thick arrows correspond to more frequent dispersal routes.

