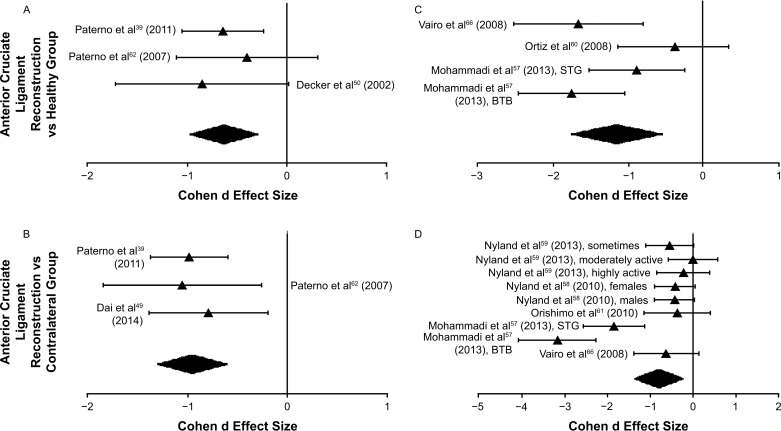
Figure 3. .
A between-groups comparison of peak vertical ground reaction forces during, A and B, double-limb and, C and D, single-limb landing tasks. Effect sizes and associated 95% confidence intervals based on peak (triangle) values are presented in the accompanying forest plot. The large, solid black diamond at the bottom of the graph represents the pooled effect size for all included data points. Abbreviations: BTB, bone-patellar tendon-bone autograft; STG, semitendinosis-gracilis autograft.

