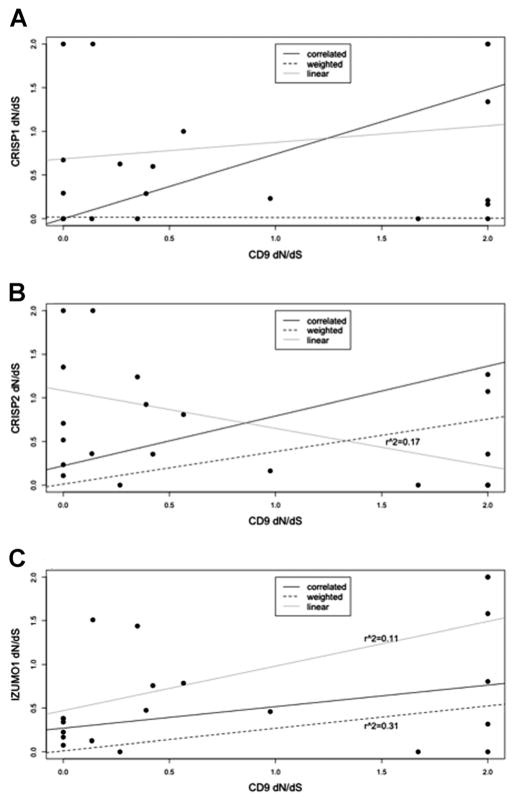
Figure 3.
Linear regressions of sperm–egg correlations. A: CD9 and CRISP1 dN/dS values were estimated for each branch of a 12-species phylogeny and plotted on the graph. The line of regression for each correlation model was plotted using the points, with adjustments as stated in methods section: Correlation likelihood model (black line), standard linear regression (gray line), weighted linear regression (hashed line). B: CD9 and CRISP2 dN/dS values were estimated on each branch of a 12-species phylogeny. C: CD9 and IZUMO1 dN/dS values were estimated on each branch of a 12-species phylogeny.

