Fig. 2.

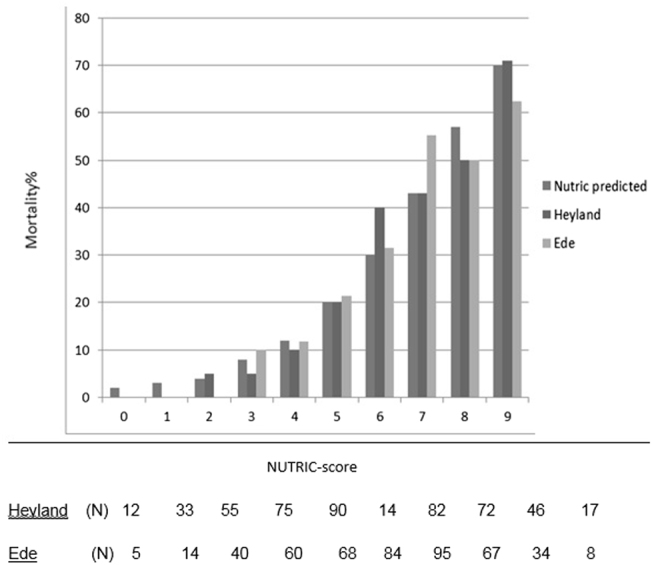
NUTRIC-scores and 28 days mortality. NUTRIC predicted, first bar, is a predicted value, no patients. Heyland et al. [6], middle bar, with number of patient (N), Ede, last bar, number of patients (N) per NUTRIC score category

NUTRIC-scores and 28 days mortality. NUTRIC predicted, first bar, is a predicted value, no patients. Heyland et al. [6], middle bar, with number of patient (N), Ede, last bar, number of patients (N) per NUTRIC score category