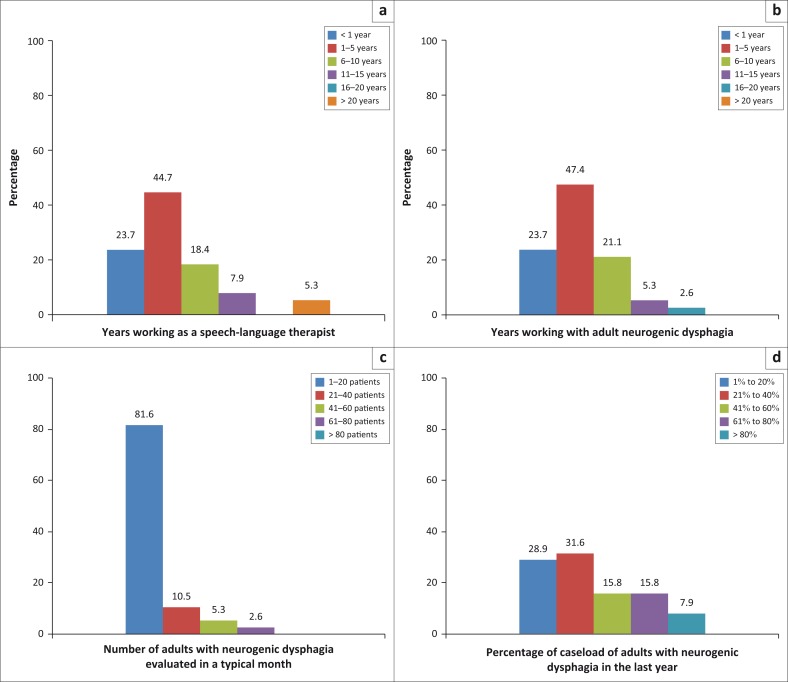
FIGURE 2.
Biographical information of participants (n = 38): (a) Years working as a speech-language therapist; (b) Years working with adult neurogenic dysphagia; (c) Number of adults with neurogenic dysphagia evaluated in a typical month; and (d) Percentage of caseload of adults with neurogenic dysphagia in the last year.

