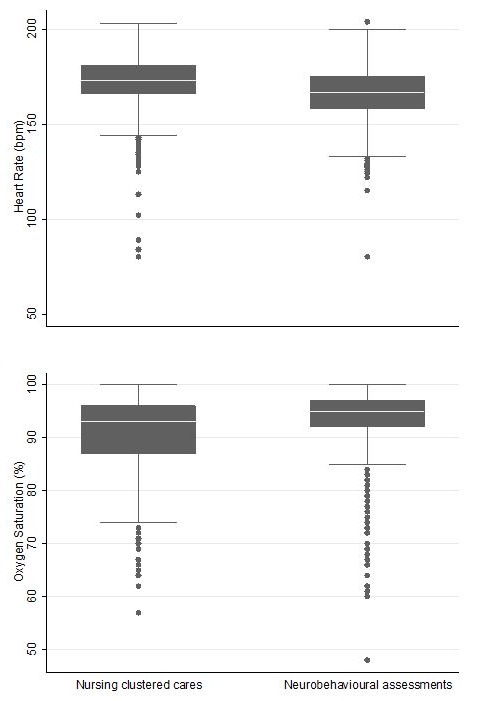
Figure 2.

Heart rate and oxygen saturation mean values for standardised neurobehavioural assessments and clustered nursing cares. Median is the solid white line within the box, the 25th and 75th centiles are represented by the margins of the box, and the whiskers represent the range of the data, up to 1.5 times the width of the box, with outliers beyond those ranges represented by separate points.
