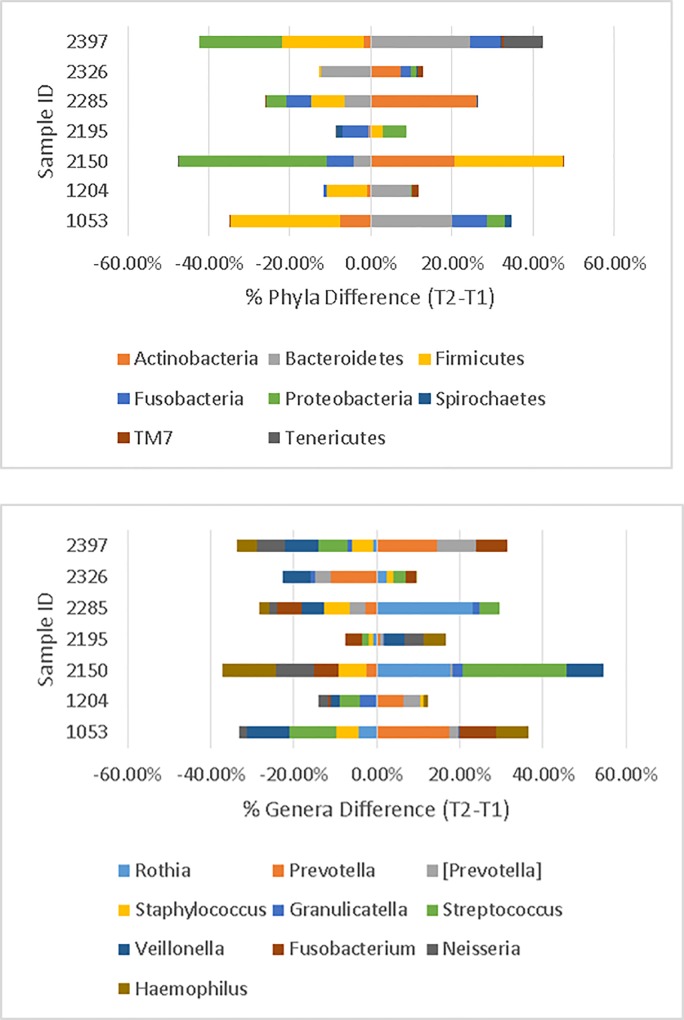
Fig 4.
Top. Differences in percent of taxonomic abundances at the phylum level in the 9-month study (T2 minus T1). For example, patient 2150 had a 36.4% decrease in abundance of Proteobacteria from T1 to T2. Bottom. Differences in percent of taxonomic abundances at the Genus level (T2 minus T1). Top taxa are displayed. Figs were created in Excel2010.

