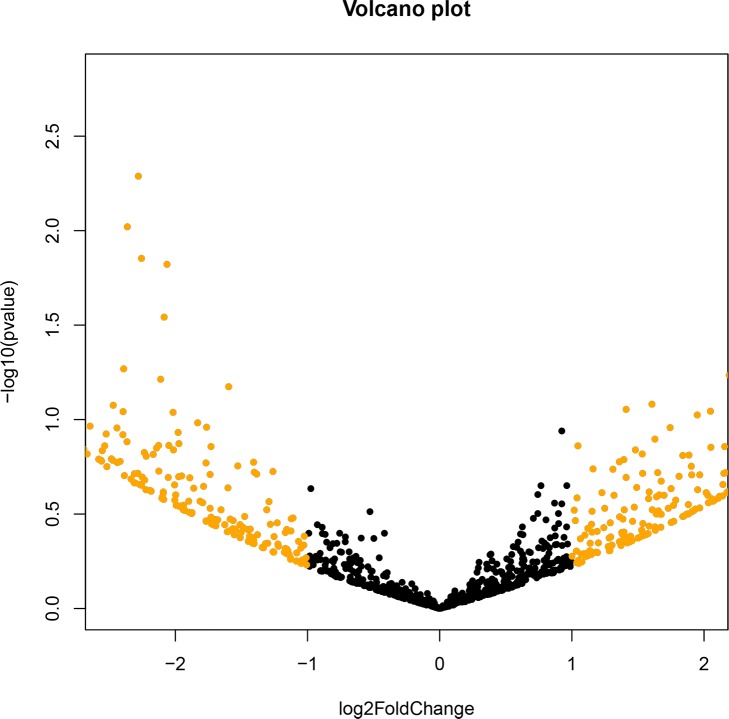
Fig 5. Volcano plot for the 9-month study.
Pairwise comparisons using DESeq2 version 1.6.3). Results shown are from all seven participants. Color differences show relative abundance of at least 2-fold, or log2 equal to or less than 1 (black) versus greater than 1 (gold). Fig was created in R phyloseq, (version 1.10.0).

