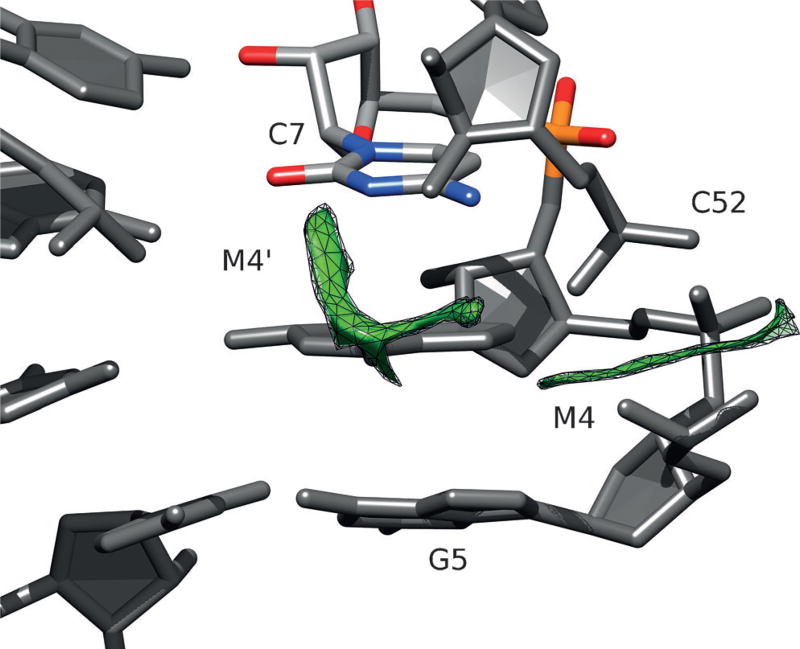
Figure 1.
Difference map of cation number density from 3D-RISM calculations of the solution structure and crystallographic coordinates. The green mesh surfaces indicate that there is a predicted increase in cation density at both the crystallographic M4 site (where a Mg2+ ion is observed to directly coordinate G5 proR and C52 proR), as well as the Watson–Crick edge of residue C7 (shown in a colored stick representation) labeled as the M4′ site.

