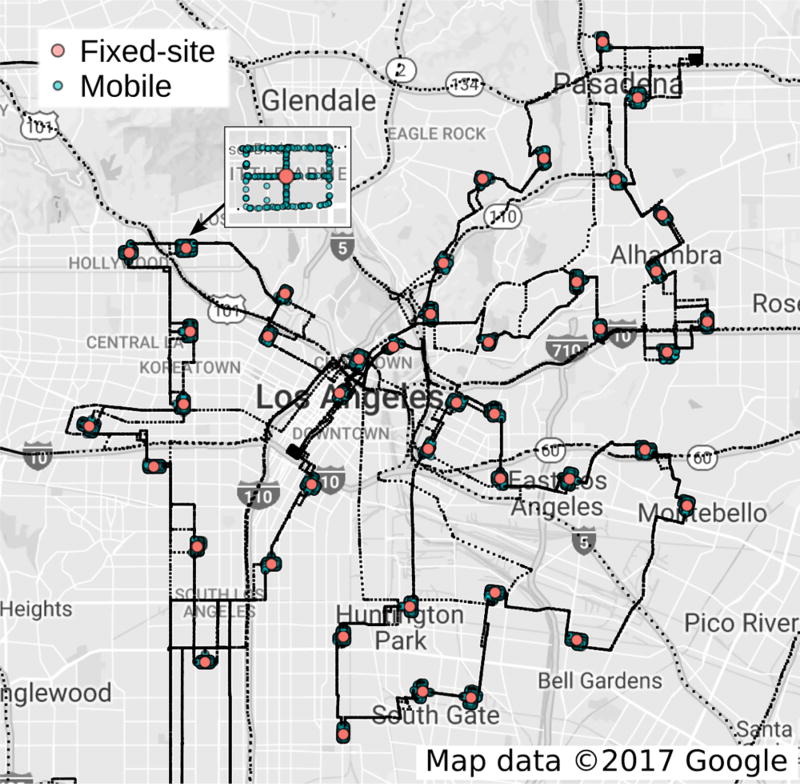
Figure 1.
Locations of 43 fuzzy points with the fixed sites (in red) and mobile sampling sites within a 300 m radius around each intersection (in blue) in the summer campaign. Black lines connecting the fuzzy points indicate the continuous mobile route. The inset near the top left shows an enlarged map of one of the fuzzy points.

