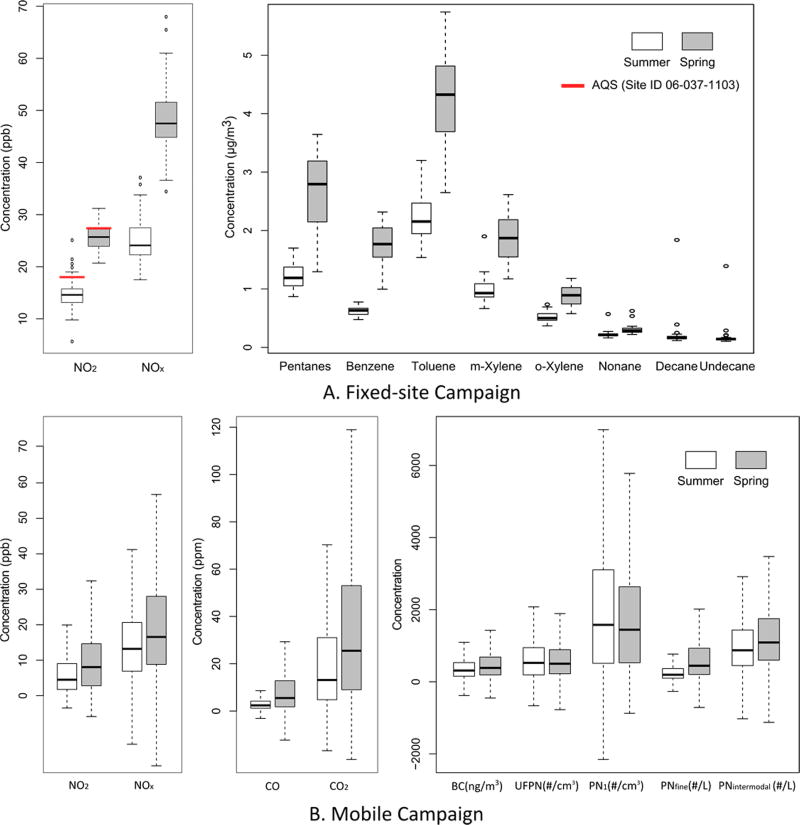
Figure 2.
Distribution of pollutant concentrations. Fixed-site platform results are shown at the top (A) and mobile platform results are shown at the bottom (B). Pentanes are divided by 100 and include pentanes and hexanes. Dodecane and undecane are not available in spring due to measurements below the limit of detection (LOD) and/or the limit of quantification (LOQ). CO measurements are multiplied by 10, UFPN measurements are divided by 10, and PNfine measurements are divided by 100. The AQS measurements of NO2 for the same period of time in central Los Angeles (GPS 34.066590, −118.226880) are shown as red lines in part A. Some outliers are not displayed in the figure to facilitate visual comparison.

