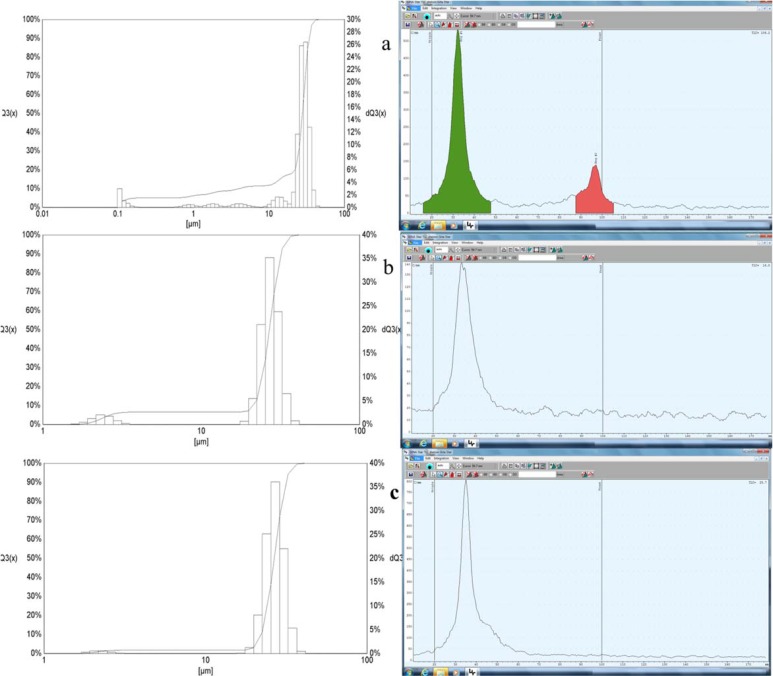
Figure 1.
The RTLC results (on the right sides) and the Fritsch Particle sizer results (left side) of the MAA a) after labeling with 68Ga b) after first centrifuge and c) after 2 times centrifuge post labeling. The X and Y axises for the Fritsch Particle sizer were the mean size diameter and the intensity, respectively

