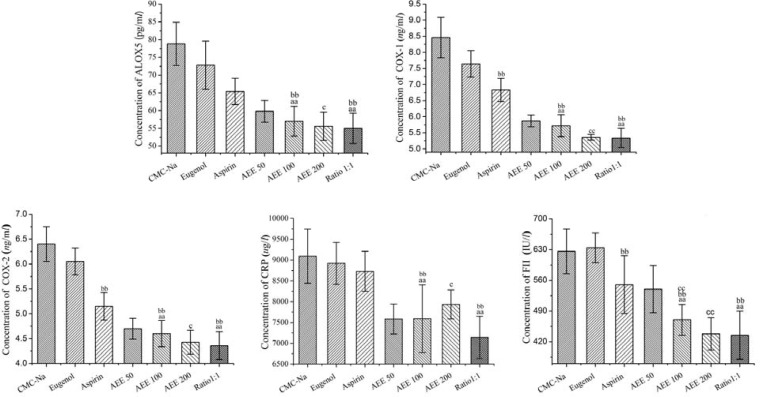
Figure 2.
Effects of different drugs on key endogenic bioactive enzymes after drugs administration for seven days (n = 10). The concentrations of enzymes in serum were measured by ELISA method. Values were presented as mean ± SD. Multiple comparisons were carried out to find out the difference between AEE and its precursor. aaP < 0.01 compared with aspirin group. bbP < 0.01 compared with eugenol group. cP < 0.05, ccP < 0.01 compared with low-dose of AEE group. Ratio 1:1, integration of aspirin and eugenol, molar ratio 1:1, at 0.3067 mmol

