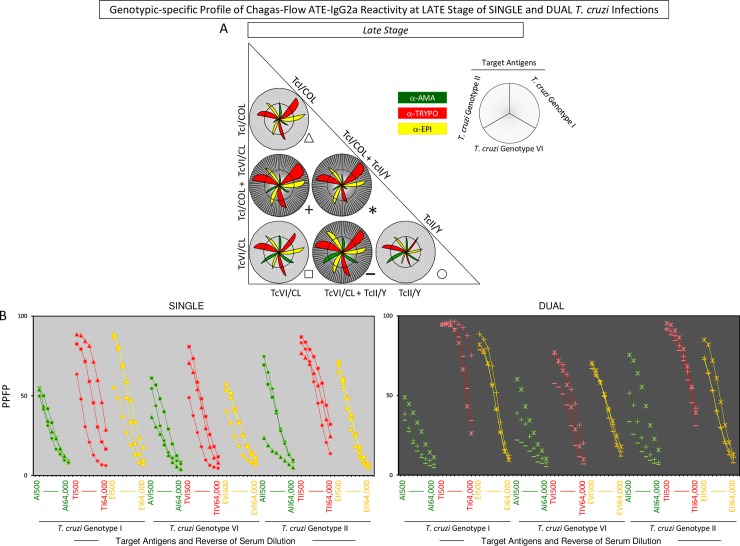
Fig 6. Genotype-specific profile of Chagas-Flow ATE-IgG2a reactivity at late stage of single and dual T. cruzi infections.
(A) Overall reactivity profile of sera samples at late stage of single (TcI/COL, n = 29; TcVI/CL, n = 29 and TcII/Y, n = 35) and dual (TcI/COL+TcVI/CL, n = 28; TcVI/CL+TcII/Y, n = 43 and TcI/COL+TcII/Y, n = 36) T. cruzi infections with distinct genotypes. The IgG2a reactivity was evaluated along the titration curve with each target-antigens amastigote (AMA = green), trypomastigote (TRYPO = red) and epimastigote (EPI = yellow) from TcI, TcVI and TcII genotypes of T. cruzi. The results are shown on radar charts and expressed as mean of percentage of positive fluorescent parasites (PPFP). (B) Titration curves were assessed at eight serum dilutions (1:500 to 1:64,000) using target-antigens AI, AVI and AII; TI, TVI and TII along with EI, EVI and EI at late stage of single [TcI/COL (triangle), TcVI/CL (square), TcII/Y (circle)] and dual [TcI/COL+TcVI/CL (cross), TcVI/CL+TcII/Y (dash), TcI/COL+TcII/Y (asterisk)] T. cruzi infections.

