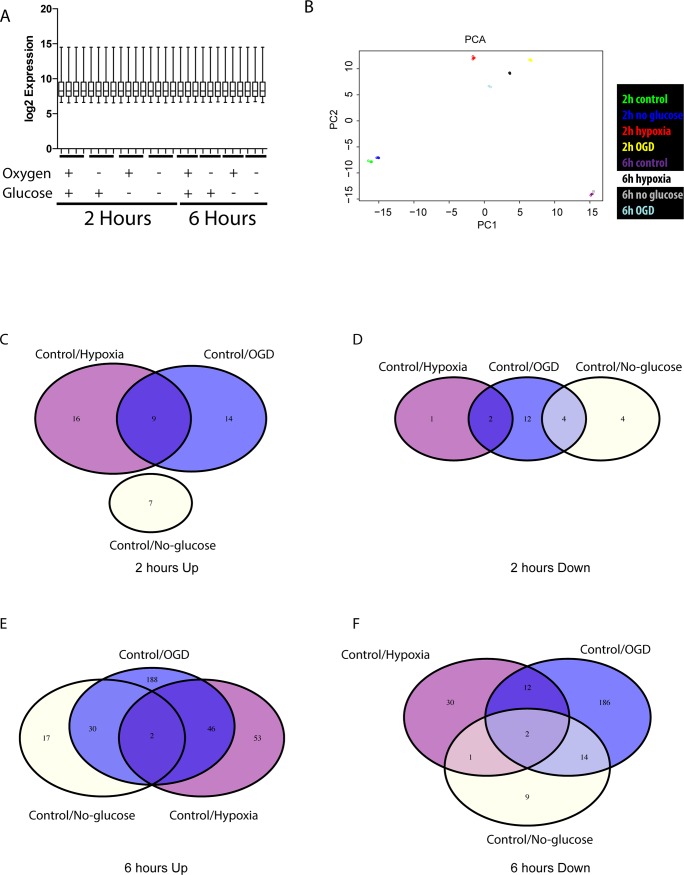
Fig 1. OGD produces a stronger gene regulatory response than hypoxia and glucose deprivation alone.
(A) Normalised log2 transformed gene expression data was compared in a box plot to ensure that normalisation was equal between the samples of the bead-array. Error bars show standard deviation (SD). (B) PCA-plot of the top 500 probe sets p<0.05 comparisons to control to show that the replicates within the gene expression data group according to treatments. (C, E) Venn diagrams were constructed from the upregulated genes, (C) fold change (fc) >1.5 with a p-value <0.05 after 2hs or (E) 6 hs of: Control, Hypoxia, or oxygen and glucose deprivation (OGD). (D, F) Venn diagrams of down regulated genes fc<0.66, p-value <0.05 in (D) 2h or (F) 6 h treatments as in (C, E).

