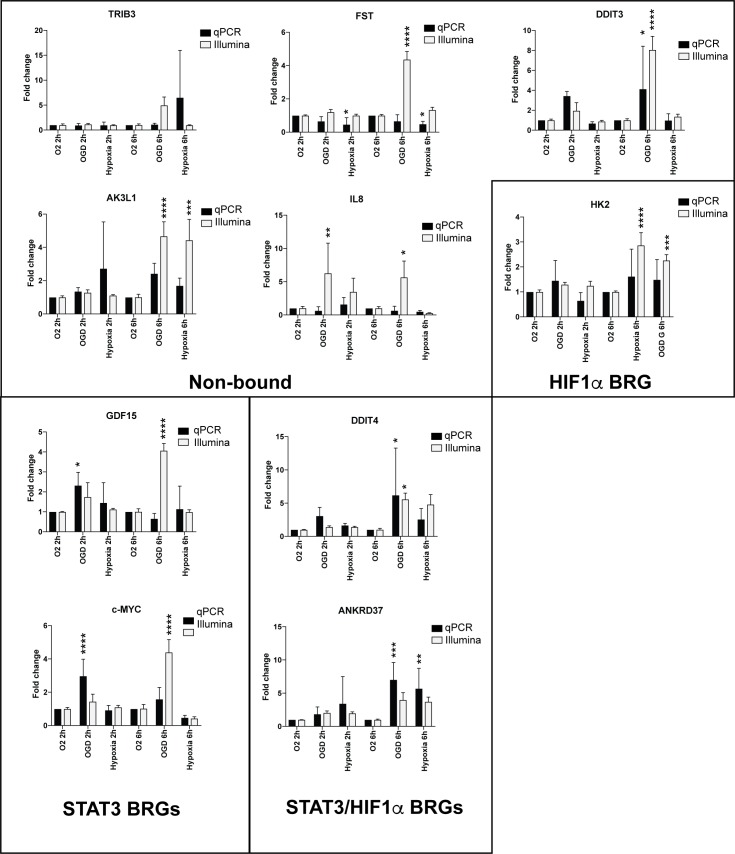
Fig 5. STAT3 BRGs c-MYC and GDF are upregulated 2h after treatment.
QPCR of normoxic, hypoxia or OGD treated SVZ pericytes with 2h or 6h treatments. SVZ pericytes were analysed for differences in expression of the indicated transcripts with qPCR (n = 3) and compared to Illumina data (n = 4 or n = 3). The individual analysed transcripts were grouped into non-bound (not bound by either STAT3 or HIF1α as BRGs), STAT3 BRGs, HIF1α/STAT3 combined BRGs or HIF1α BRGs. Statistic analysis was made using 2-way ANOVA and error bars represent standard deviations of the mean (SEM); *p<0.05, ** P<0.01, ***p<0.001, ****p<0.0001.

