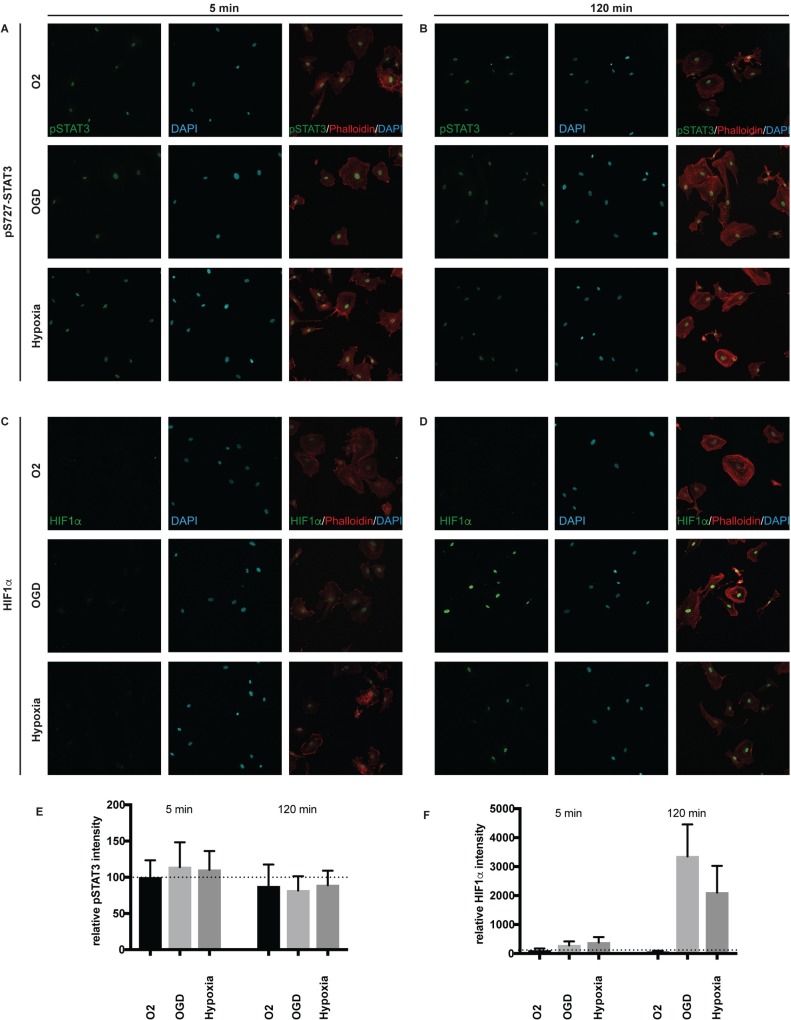
Fig 6. PSTAT3 is increased in the nucleus of pericytes after 5min of OGD or hypoxia.
Localization of pSTAT3 and HIF1a over time. (A) Confocal images showing pS727STAT3 (green), DAPI (blue) and Phalloidin (red) after 5 minute treatment of Normoxia (upper panel), OGD (middle panel) and OGD + Glucose (lower panel). (B) Confocal images showing pS727STAT3 (green), DAPI (blue) and Phalloidin (red) after 120 minute treatment of normoxia (upper panel), OGD (middle panel) and hypoxia (lower panel). (C) Confocal images showing HIF1α (green), DAPI (blue) and Phalloidin (red) after 5 minute treatment of Normoxia (upper panel), OGD (middle panel) and hypoxia (lower panel). (D) Confocal images showing HIF1α (green), DAPI (blue) and Phalloidin (red) after 120 minute treatment of Normoxia (upper panel), OGD (middle panel) and hypoxia (lower panel). (E) Quantification of nuclear intensity of pS727STAT3 in all conditions at 5 and 120 min. (F) Quantification of nuclear intensity of pS727STAT3 in all conditions at 5 and 120 min.

