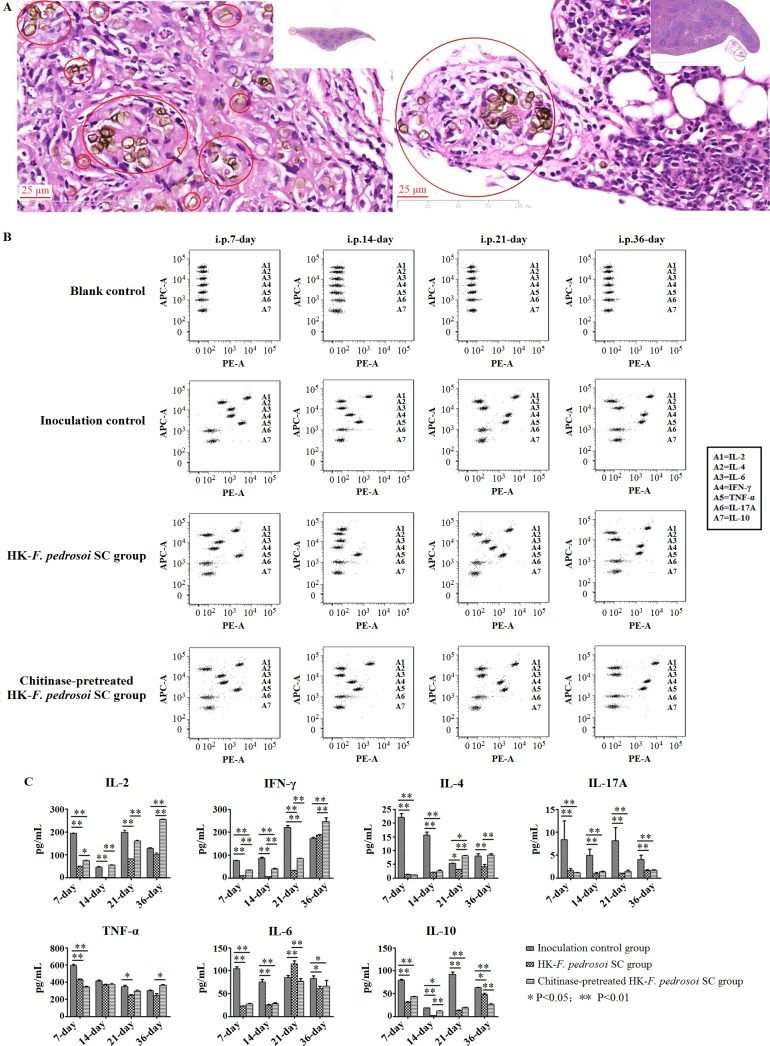
Fig 14. Chitin contributes to an inhibited IFN-γ production in splenocytes of BALB/c mice after intraperitoneal stimulation of heat-killed F. pedrosoi sclerotic cells.
(A-C) The BALB/c mice were intraperitoneally injected for 3 times at 7-day intervals with in-vitro transformed F. pedrosoi-sclerotic cells which were heat-killed and treated with chitinase or not. (A) HE staining (×400) for the spleens isolated from BALB/c mice at 36 days after initial injection of heat-killed F. pedrosoi-sclerotic cells with chitinase treatment (left panel) or not (right panel). The sclerotic cells with cross -septation in the nidus were indicated by red circles. (B) BD Cytometric Beads Array (CBA) murine cytokine kit was introduced to measure the Th1/Th2/Th17 cytokine levels in culture supernatants of splenocytes from BALB/c mice at 7 days, 14 days, 21 days and 36 days after initial injection of heat-killed F. pedrosoi-sclerotic cells with chitinase treatment or not (n = 16 per group). The BALB/c mice intraperitoneally inoculated with normal saline were set as inoculation control (n = 16). Before measurement, the splenocytes from BALB/c mice were adjusted to 2×10⁶ cells in a volume of 2 mL RPMI1640 plus 10% FCS, and were pretreated with 1×Cell Stimulation Solution at 37°C for 6h. Seven bead populations with distinct APC-A fluorescence intensities had been coated with capture Abs specific for IL-2, IL-4, IL-6, IFN-γ, TNF-α, IL-17A and IL-10 proteins, as indicated by A1-A7 in turns. The concentration of specific cytokine mentioned above can be revealed by the fluorescence intensity of PE-conjugated detection Ab, and be calculated according to the standard curve established by cytokine standards using FCAP Array software. The assay diluent incubated with beads and PE-conjugated Ab was set as blank control. (C) Graph showing the concentration (pg/mL) of Th1/Th2/Th17 cytokines produced by splenocytes from BALB/c mice intraperitoneally stimulated with heat-killed F. pedrosoi-sclerotic cells with chitinase treatment or not as well as inoculation controls at the indicated days after initial inoculation. Data represent the mean±SEM (n = 4 per group at each indicated time point), and statistical analysis was performed using Univariate ANOVA and LSD-t test. Significant: * P<0.05; Highly Significant: ** P<0.01.

