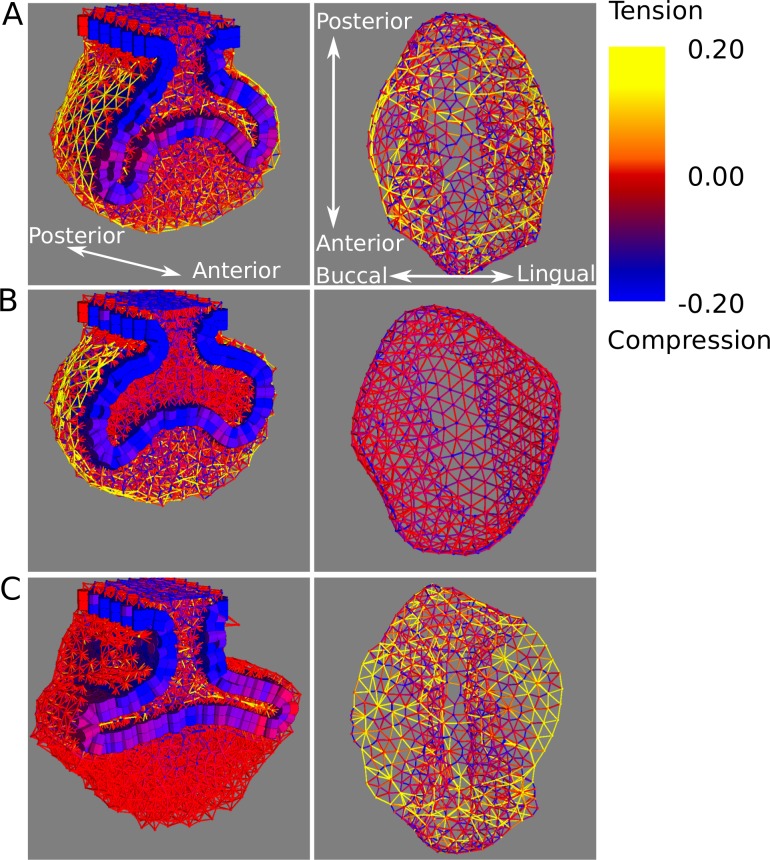
Fig 7. Mechanical forces acting on the different tooth tissues in the model.
Spatial distribution of forces are shown for three different tooth morphologies at cap stage simulated with different adhesion parameters: bss = 5.0, bmm = 1.0 (A), bss = 0.0, bmm = 5.0 (B), bss = 5.0, bmm = 0 (C), while the other adhesion parameters are equal to 1.0. Intensity and directionality of forces in the mesenchyme and suprabasal layer are depicted with rods connecting each pair of neighbouring cells. Rod colour indicates sign (i.e. negative = compression; positive = tension) and intensity of force. Rods are not displayed in epithelial cells, instead cylinder colour corresponds to the average of all the forces acting on it. For each simulation, frontal sections are shown from an oblique view (left column) and also the suprabasal tissue alone seen from below (right column, note that we only show the suprabasal cells in contact with the epithelium for a clearer picture of single rods). The growth parameters used in all three simulations are the same as for the simulations in Fig 6.

