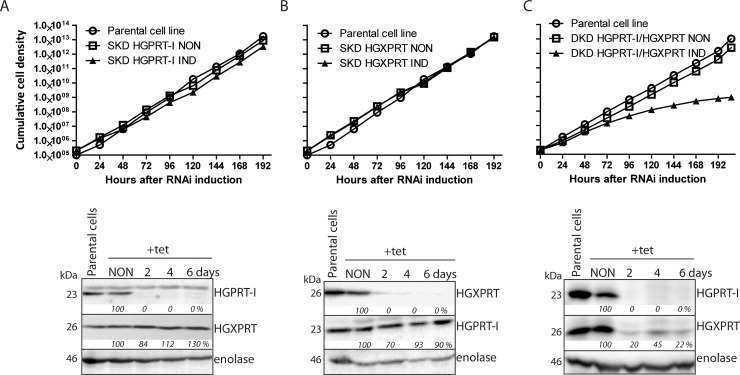
Fig 5. Effects of RNAi silencing of HGPRT-I, HGXPRT and simultaneous RNAi silencing of HGPRT-I/HGXPRT on T. brucei BF cell growth.
Growth curves of the noninduced (NON) and RNAi induced (IND) cells in which the expression of HGPRT-I (A) HGXPRT (B) and HGPRT-I/HGXPRT (C) was RNAi silenced. Cells were cultured in HMI-9full media and the cumulative cell number was calculated from cell densities adjusted by the dilution factor needed to see the cultures at 105 cells/ml each day. The figure is representative of at least three independent RNAi inductions. The steady-state abundance of HGPRT-I and HGXPRT in noninduced (NON) RNAi cells and in cells induced with tetracycline for 2, 4 and 6 days (A, B and C, bottom panels) was determined by immunoblotting using specific anti-HGPRT-I and anti-HGXPRT serums. Densitometric analysis was performed using the Image Lab 4.1 software and the determined values were normalized to an enolase loading control signal. The protein marker sizes are indicated on the left.

