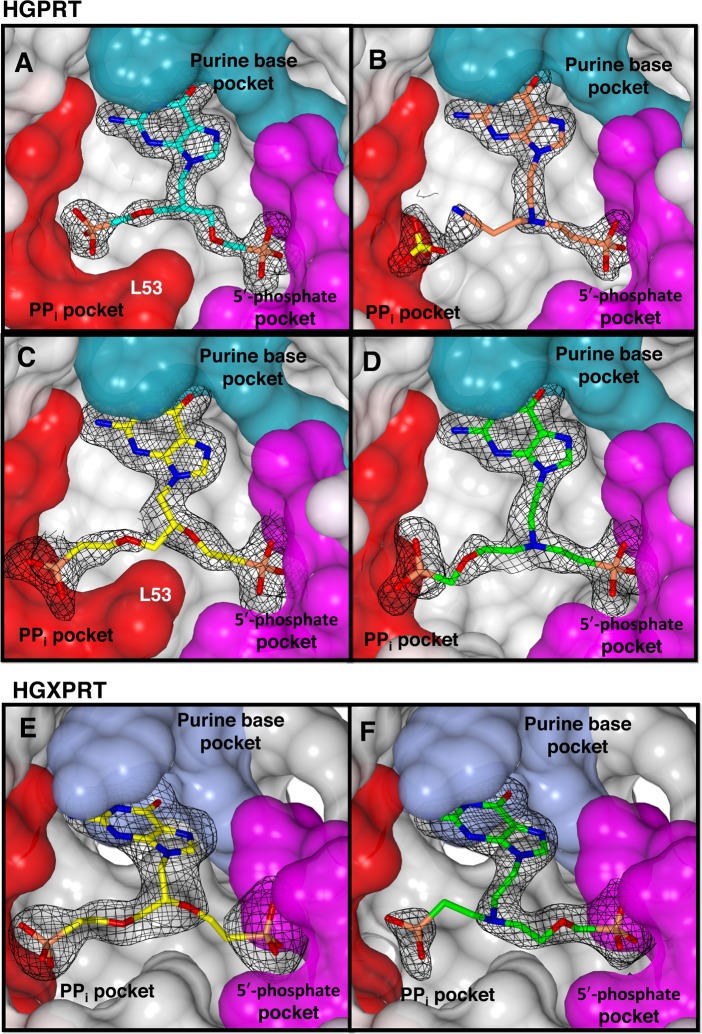
Fig 11. The active site of HGPRT-I and HGXPRT.
Each enzyme is represented by its Connolly surface and the inhibitor is shown as a stick model. The Fo-Fc electron density for each inhibitor is overlaid. (A) HGPRT-I.6 complex, (B) HGPRT-I.1 complex, (C) HGPRT-I.7 complex, (D) HGPRT-I.2 complex, (E) HGXPRT.7 complex and (F) HGXPRT.2 complex.

