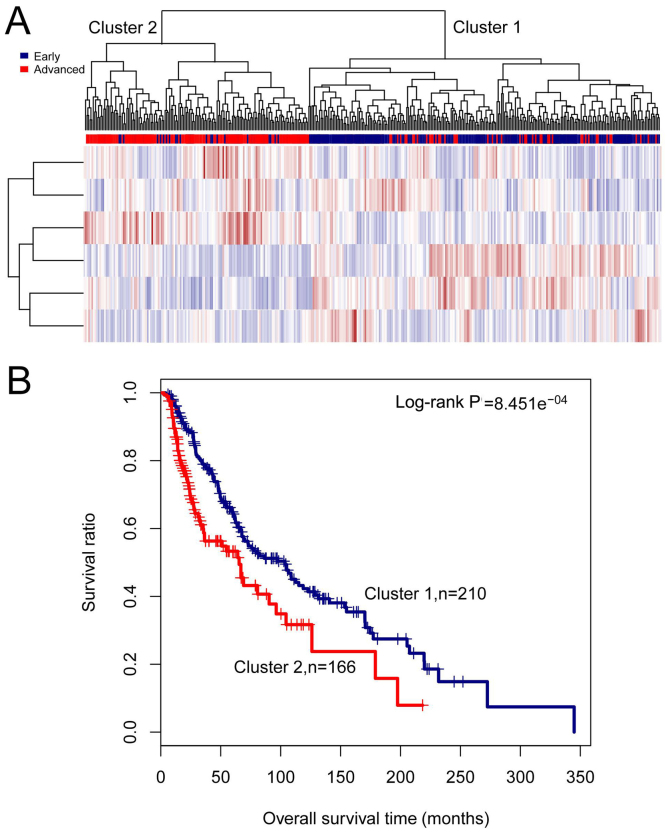
Figure 4.
Results of the two-way hierarchical clustering analysis based on six signature long non-coding RNAs (lncRNAs) in the training set. (A) A heatmap for clustering analysis. All samples in the training set are stratified into cluster 1 and cluster 2. (B) Kaplan-Meier survival curves of cluster 1 (blue) and cluster 2 (red) obtained from the two-way hierarchical clustering analysis.

