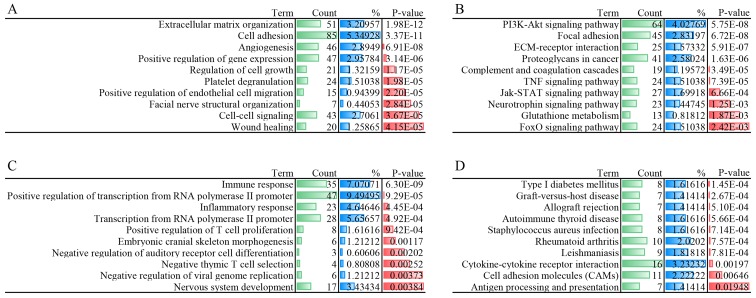
Figure 3.
Gene Ontology functional and KEGG pathway enrichment analysis. The top 10 terms were selected according to P-value. (A) Biological process of set A. (B) Enriched KEGG pathways of set A. (C) Biological process of set B. (D) Enriched KEGG pathways of set B. KEGG, Kyoto Encyclopedia of Genes and Genomes.

