. 2018 Mar 8;7:e33562. doi: 10.7554/eLife.33562

Figure 2. An example of a RSFC spatial pattern.

Left: seed region; Mid: RSFC pattern of the seed. Color bar indicates t values; Right: average of rsfMRI frames matched to the RSFC pattern. Color bar shows BOLD amplitude. Distance to bregma is listed at the bottom of each slice. CC: spatial correlation coefficient between the average of rsfMRI frames (Right) and the corresponding seed map (Mid).

Figure 2.

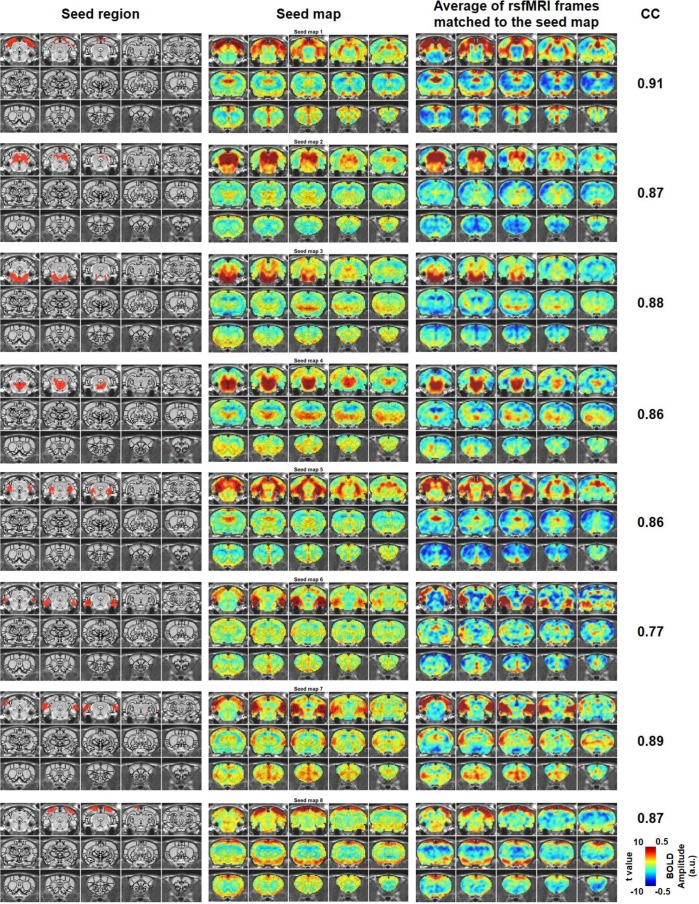
Figure 2—figure supplement 1. Characteristic RSFC patterns (1-8) in the awake rat brain.

Figure 2—figure supplement 1.

Left: seed region; Mid: RSFC pattern of the seed; Right: average of rsfMRI frames matched to the RSFC pattern. Distance to bregma for each slice is the same as those shown in Figure 2. CC: spatial correlation coefficient between the average of rsfMRI frames and the corresponding seed map.
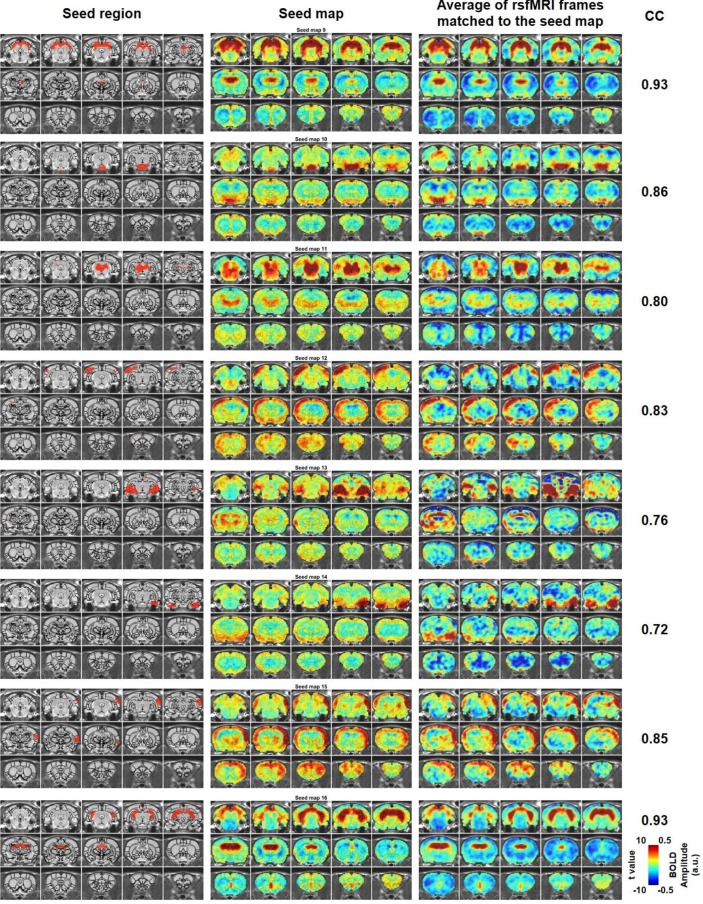
Figure 2—figure supplement 2. Characteristic RSFC patterns (9-16) in the awake rat brain.

Figure 2—figure supplement 2.

Left: seed region; Mid: RSFC pattern of the seed; Right: average of rsfMRI frames matched to the RSFC pattern. Distance to bregma for each slice is the same as those shown in Figure 2. CC: spatial correlation coefficient between the average of rsfMRI frames and the corresponding seed map.
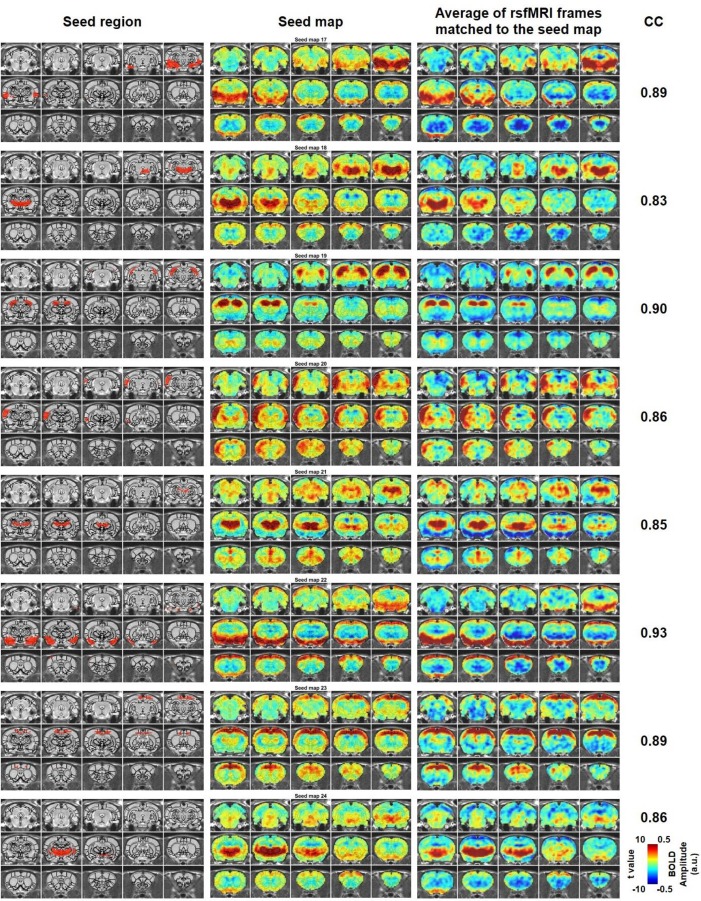
Figure 2—figure supplement 3. Characteristic RSFC patterns (17-24) in the awake rat brain.

Figure 2—figure supplement 3.

Left: seed region; Mid: RSFC pattern of the seed; Right: average of rsfMRI frames matched to the RSFC pattern. Distance to bregma for each slice is the same as those shown in Figure 2. CC: spatial correlation coefficient between the average of rsfMRI frames and the corresponding seed map.
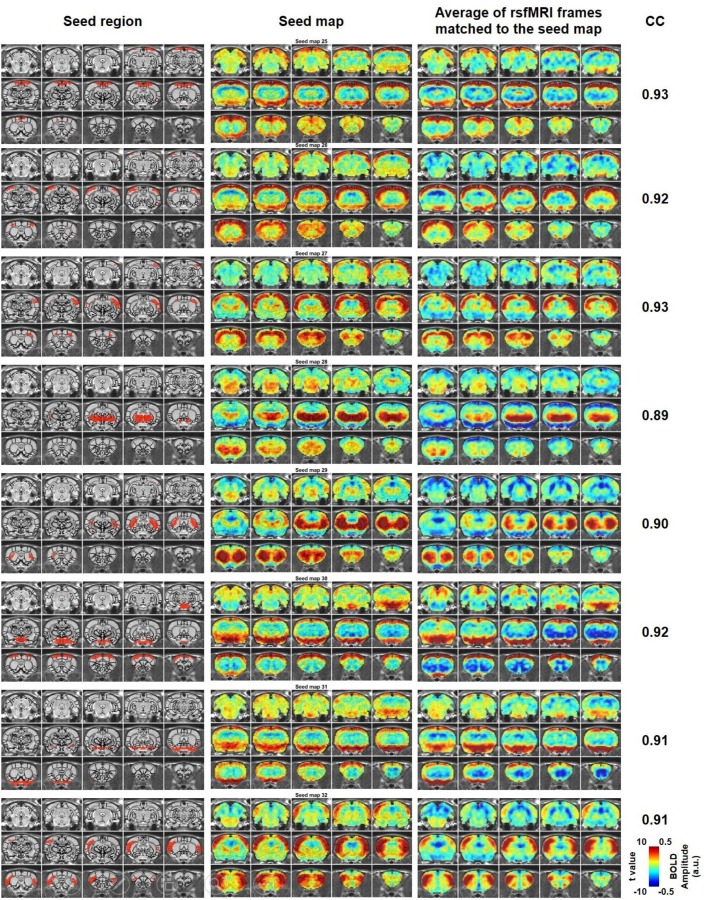
Figure 2—figure supplement 4. Characteristic RSFC patterns (25-32) in the awake rat brain.

Figure 2—figure supplement 4.

Left: seed region; Mid: RSFC pattern of the seed; Right: average of rsfMRI frames matched to the RSFC pattern. Distance to bregma for each slice is the same as those shown in Figure 2. CC: spatial correlation coefficient between the average of rsfMRI frames and the corresponding seed map.
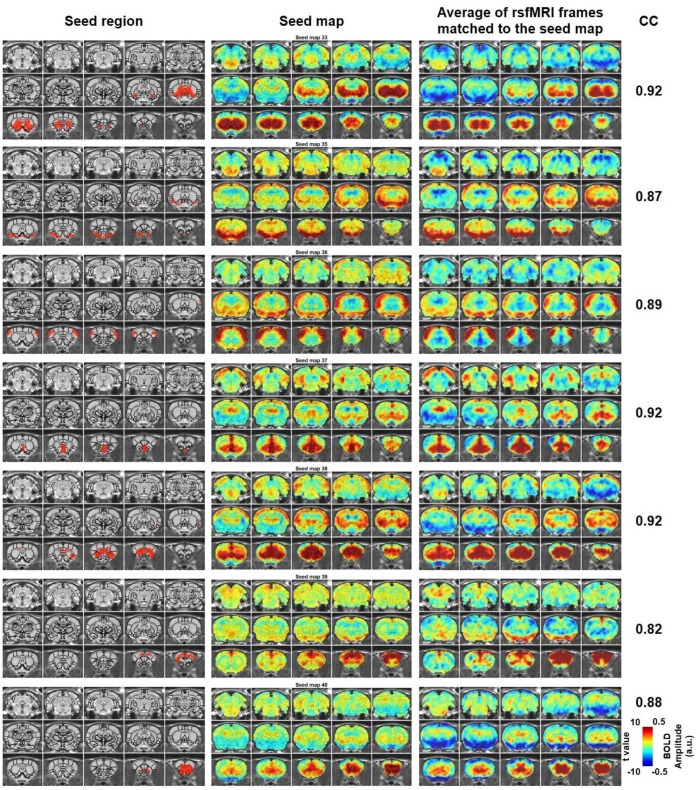
Figure 2—figure supplement 5. Characteristic RSFC patterns (33, 35-40) in the awake rat brain.

Figure 2—figure supplement 5.

Left: seed region; Mid: RSFC pattern of the seed; Right: average of rsfMRI frames matched to the RSFC pattern. Distance to bregma for each slice is the same as those shown in Figure 2. CC: spatial correlation coefficient between the average of rsfMRI frames and the corresponding seed map.