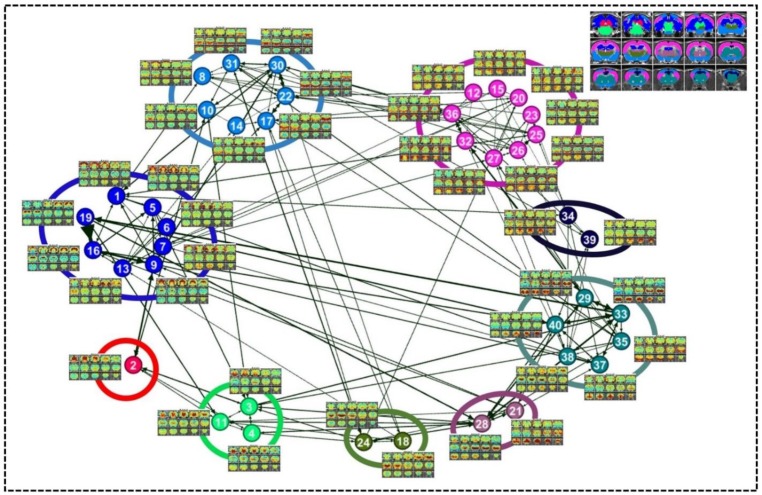
Figure 5. Community structures of the RSFC pattern transition network.
The thresholded transition matrix in Figure 4 was used as the adjacency matrix to generate a directed weighted graph. The layout of nodes was based on a force-field algorithm (Jacomy et al., 2014). The node number corresponds to the seed map number in Figure 2 and Figure 2—figure supplement 1—5. Inlet: seed regions of RSFC patterns colored coded based on the community affiliations of nodes (i.e. RSFC patterns).

