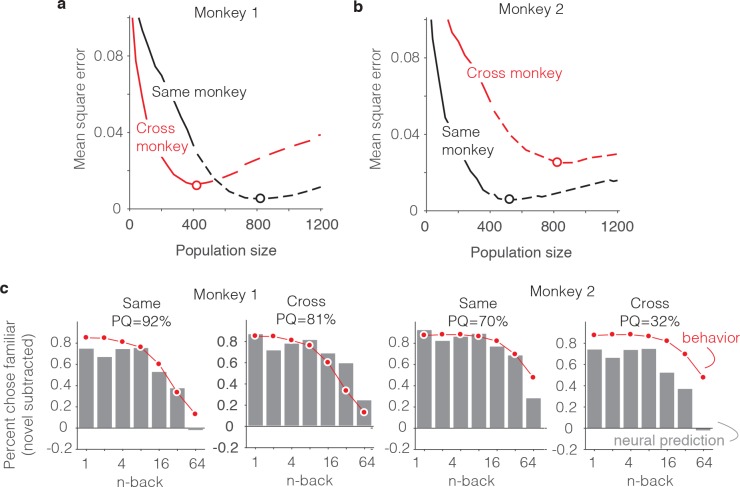
Figure 10. Alignment of individual behavioral and neural data.
(a–b) Plot of mean squared error as a function of population size, computed as described for Figure 6g but compared when behavioral and neural data come from the same monkey (black) versus when behavioral and neural data are crossed between monkeys (red). (c) Comparison of predicted and forgetting functions, plotted after subtracting the false alarm rate for novel images as in Figure 7e, for population sizes indicated by the dots in panels a-b. PQ = prediction quality.

